Operations | Monitoring | ITSM | DevOps | Cloud
The latest News and Information on DevOps, CI/CD, Automation and related technologies.
Deploying Sysdig from the new AWS CloudFormation Public Registry
AWS CloudFormation provides an easy way to model and set up AWS resources to help you save time in deploying the stack you need to run your applications. Today, AWS announced the launch of AWS CloudFormation Public Registry. CloudFormation Public Registry is a searchable collection of extensions that allows you to easily discover, provision, and manage resource types and modules published and maintained by AWS Partner Network (APN) partners like Sysdig.
Artifactory DevOps Tool Overview - Online Course SNEAK PEEK
JFrog Product Leaders Answer swampUP Attendees' Burning Questions
OPA vs. Shipa - Are you still building overly complex rules for K8s?
In a previous post, we described how we envision cloud-native initiatives reaching the 2.0 phase, where phase 1 was centered around providing clusters and running its underlying infrastructure effectively. Now that teams are starting to move some of their existing services to a microservices architecture, developers and platform engineers are being tasked with implementing the right policies and governance controls to ensure applications are running as securely as possible.
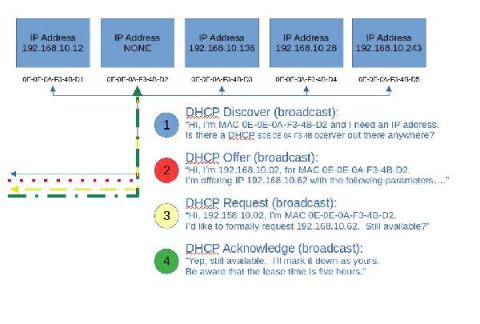
Basic DHCP concepts
Let’s step back and take a very basic look at DHCP. In fact, let’s look at the analogy of assigning a street address to your house. Usually, this is done by the local 911 dispatch office, or some other central authority. They typically use either a survey map or a latitude, longitude pair to locate you, before they assign your house numbers from a pool of available addresses, compatible with other addresses in the area.
Two-factor authentication coming to Ubuntu One
Two factor authentication (2FA) increases your account security further than just using a username and password. In addition to a password (the first factor), you need another factor to access your account. A great example to demonstrate this is when you withdraw money from an ATM. To access your bank account you need both your physical bank card and to know your PIN number. These are the two factors you need to withdraw money = 2 factor authentication!


