Operations | Monitoring | ITSM | DevOps | Cloud
Exchange Online Mail Delivery Outage, February 3rd
Exoprise CloudReady provides early detection of mission critical mail outages. On February 3rd, Microsoft had a mail delivery delay, that caused mail delivery failures and an outage. While CloudReady detected the Exchange Online mail delivery error almost 2 hours in advance, Microsoft did finally publish an incident to track the outage.
SLA Reporting: Tips & Best Practices
Service-Level Agreements (SLAs) are part of the package when it comes to defining contracts, particularly with technology service vendors. An SLA serves to define the metrics, expectations, and penalties that the service provider will adhere to, and SLA reports create accountability.
Error Budgets and their Dependencies
Improving Node.js Application Performance With Clustering
When building a production application, you are usually on the lookout for ways to optimize its performance while keeping any possible trade-offs in mind. In this post, we’ll take a look at an approach that can give you a quick win when it comes to improving the way your Node.js apps handle the workload. An instance of Node.js runs in a single thread which means that on a multi-core system (which most computers are these days), not all cores will be utilized by the app.
How to use Sentry Attachments with Mobile Applications
In a previous life as an Android developer, a customer reported a nasty bug that we didn’t know how to fix. After what felt like countless hours of debugging and writing back and forth to customer support, our only option left was to get our hands on the users’ local database. However, for a variety of reasons, we couldn’t ask the customer to root the device, copy the database, and send it to us.
Facter 4: back to the roots
Facter is a cross platform system profiling tool. It gathers nuggets of information about a system such as its hostname, IP address and operating system. We call these nuggets of information facts and they are used by other Puppet products like Puppet, Puppet Server and Bolt to make decisions in their automation process. You can extend Facter by writing custom facts or external facts and use them in Puppet manifests.
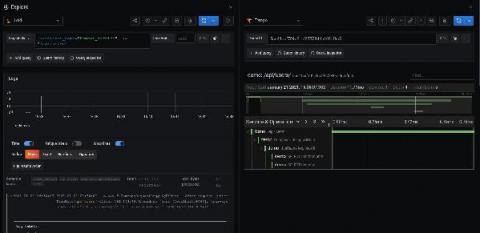
Auto-instrumenting a Java Spring Boot application for traces and logs using OpenTelemetry and Grafana Tempo
Auto-instrumentation is a subject I have not had much experience with. Here at Grafana Labs, we primarily develop in Go, which doesn’t afford such luxuries. However, there is an enormous amount of interest from the community in Java auto-instrumentation, so I set out to determine what was possible using the shiny new OpenTelemetry auto-instrumentation libraries.
SquaredUp helps customers save 20% of Azure costs
Are you suffering from overspending in Azure, lack of cost visibility and lack of context? You’re not alone; Azure cost management is a problem we hear about time and time again. That is why we created top-notch cost tiles that would allow users to build the perfect Azure cost dashboard, and help them quickly identify overspends and expensive resources in their Azure tenant.
Introduction to StatsD
StatsD is an industry-standard technology stack for monitoring applications and instrumenting any piece of software to deliver custom metrics. The StatsD architecture is based on delivering the metrics via UDP packets from any application to a central statsD server. Although the original StatsD server was written in Node.js, there are many implementations today, with Netdata being one of them.


