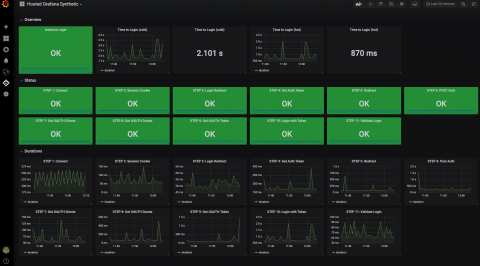
Grafana Tutorial: Simple Synthetic Monitoring for Applications
Often there’s a focus on how a service is running from the perspective of the organization. But what does service health monitoring look like from the perspective of a user? There are many metrics that indicate the overall health of a container, vm, or application, but independently they do not indicate if the system is functioning correctly. Often these metrics (CPU, disk, memory) are too narrow, and they can be poor indicators. High CPU may be desirable or bursts of memory usage may be normal.


