Operations | Monitoring | ITSM | DevOps | Cloud

Latest News

Introduction to instrumenting applications with Prometheus

As a developer, getting metrics from your application onto a Prometheus graph can seem daunting. We’ll look at analyzing your service to find the most useful places to add metrics, how to add that instrumentation, getting it exposed and scraped, and then basic queries to use those metrics on graphs. Check out another article of mine for general reference on instrumenting, this one on Prometheus metrics, or this comparison on instrumentation alternatives.

This Month in Spring - July 2020

Hi, Spring fans! 2020, eh? It's easy to complain, and goodness knows I certainly do my fair share, but - as my dad always said, "any day on this side of the dirt is a good day," and I try to remember that. There's a lot to be enthusiastic about if you like. I always look. That's what this roundup is all about. It's a fount of the fun, fantastic, production-powered, and boundless beauty of all things Spring Boot.

Double Header: Konvoy 1.5 and Kommander 1.1 Are GA!

Today we made Konvoy 1.5 and Kommander 1.1 generally available. In January, D2iQ defined a 12 month roadmap for Kommander and Konvoy. With these newest releases focused on the Single Enterprise Experience, that mission is halfway complete. Here are some of the highlights of the latest releases.

Announcing Native Support for Kubernetes Secrets in Codefresh Pipelines

Secret management has been one of the most challenging areas when it comes to application deployments. Especially in the era of containers and dynamic services that come and go all the time, secret storage and rotation is more important than ever. Today we release our brand-new secret management integration that allows you to use Kubernetes secrets and configmaps straight into Codefresh pipelines in the easiest way possible.

12 Container image scanning best practices to adopt in production

Don’t miss out on these 12 image scanning best practices, whether you are starting to run containers and Kubernetes in production, or want to embed more security into your current DevOps workflow. One of the main challenges your teams face is how to manage security risk without slowing down application delivery. A way to address this early is by adopting a Secure DevOps workflow.

AWS Fargate pricing: how to optimize billing and save costs

AWS Fargate is a managed service that enables you to run containers in Amazon Elastic Kubernetes Service (EKS) or Elastic Container Service (ECS). Since Fargate is serverless, you don’t need to provision or manage servers or clusters. However, you do need to set up package containers, define resource requirements, and configure permissions and networking policies. Fargate pricing is determined according to virtual CPUs (vCPUs) requirements, as well as usage of GBs of RAM for running services.

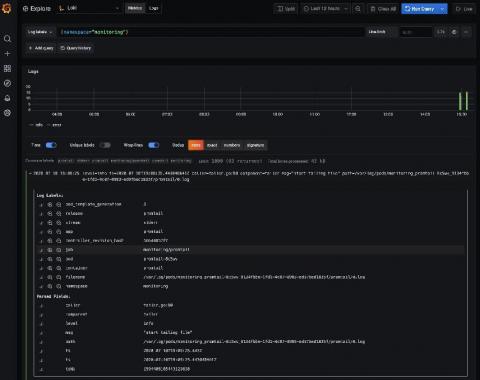
Loki tutorial: How to send logs from EKS with Promtail to get full visibility in Grafana

Amazon Elastic Kubernetes Service (Amazon EKS) is the fully managed Kubernetes service on AWS. If you’re using it and wondering how to query all your logs in one place, Loki is the answer. With this tutorial, you’ll learn how to set up Promtail on EKS to get full visibility into your cluster logs while using Grafana. We’ll start by forwarding pods logs then nodes services and finally Kubernetes events.

What can you do with MicroK8s?

MicroK8s was first released in late 2018 and has seen significant adoption rates from developers and enterprises alike ever since. Taking increasing demand and curiosity around the topic, we have already given an introduction to MicroK8s as well as covered how to deploy MicroK8s locally in previous blog posts. This time, we’ll take a look at MicroK8s’ applied value, by examining common MicroK8s use cases. Among others, this includes AI/ML workflows.