Operations | Monitoring | ITSM | DevOps | Cloud

Latest News

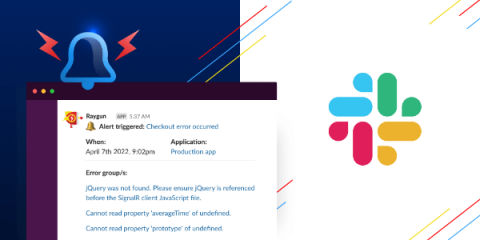
Get Alerted to mission-critical issues directly in Slack

You’ve spoken and we’ve listened and as a result, the highly anticipated Slack integration for Raygun Alerting is here! Once integrated with Slack, you’ll receive customized error, crash, and performance alert notifications directly to the channel of your choosing. Reduce your Mean Time to Resolution (MTTR) and resolve issues in your code before your customers even notice.

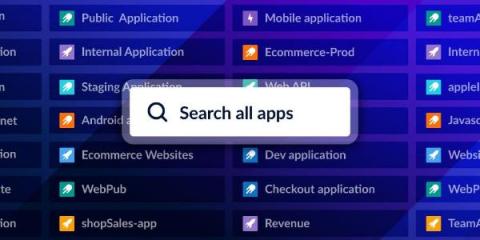
Search all apps - understand the impact of an error across your entire tech stack

One of the most requested features for Crash Reporting has been the ability to perform a search across all of your applications rather than by one application at a time (the default behavior). It’s not hard to see why it’s a popular feature request - rather than manually performing the same search across many applications, it would be super handy to perform one search and understand the impact of the search results across all of your applications immediately.

What is Azure Advisor?

Azure Advisor analyzes your configurations and usage telemetry and offers personalized, actionable recommendations to help you optimize your Azure resources for reliability, security, operational excellence, performance, and cost. Azure Advisor is a free service and can be accessed via the GUI on the Azure portal where recommendations are collated and can be manually examined. Azure Advisor makes recommendations for potential improvements in several areas, including.

Application Observability, The Next Step in Application Performance Monitoring

Today’s cloud environments rely on microservices, service meshes, containers, and orchestration tools and are too complex for traditional tools to measure and monitor performance metrics effectively. The number of interdependent services—and the inherently ephemeral nature of cloud workloads—make it challenging to identify which metrics to monitor and issues to troubleshoot down to the root cause.

An introduction to OpenTelemetry Metrics

OpenTelemetry is a collection of APIs, SDKs, and libraries that provide an open source observability framework for instrumenting, generating, collecting, and exporting telemetry data like metrics, traces, and logs. It is incubated under Cloud Native Computing Foundation (CNCF), the same foundation which incubated Kubernetes. OpenTelemetry is quietly becoming the world standard for instrumenting cloud-native applications.

Choosing the Best Virtual Desktop Infrastructure (VDI) Technology for Your Enterprise

Virtual desktop infrastructure (VDI) is a technology that refers to the use of virtual machines to provide and manage virtual desktops. Users access virtual desktops from their laptops, desktops, thin clients, or mobile devices from anywhere. Virtual desktops are hosted in a data center, on servers, and all the necessary processing is done on the server that hosts the virtual desktops.