Operations | Monitoring | ITSM | DevOps | Cloud

Latest News

Hot Topic: Increasing Cost-Efficient Observability with Cold Tier

Even as the global economy shows signs of a rebound, today’s observability customers are more focused than ever on driving utmost value from their investments. This isn’t simply because economics have forced organizations to closely review overhead and drive out unnecessary costs; the reality is that observability has become one of the leading budget items for every cloud software organization, full stop.

Grafana Loki 2.9 release: TSDB volume endpoints, remote rule evaluations, LogQL optimizations

The Loki squad is excited to announce Grafana Loki 2.9 is here! For this release, we’ve developed additional TSDB endpoints to help you better understand your log volume; introduced query language optimizations to make parsing more performant; and restructured our documentation so it is easier to use. This coincides with the release of Grafana Enterprise Logs (GEL) 1.8, so all the features discussed here are available in both Loki 2.9 and GEL 1.8.

12 DevOps Best Practices Teams Should Follow

DevOps is a software development philosophy that helps organizations achieve faster delivery, better quality, and more reliable software, making it easier to adapt to changing business needs and customer demands. However, implementing DevOps can be challenging on many levels. It requires changes in culture, processes, skills, knowledge, and tools, which can encounter resistance from traditional silos within organizations. So, how can you successfully implement DevOps within an organization?

Effective Logging in Node.js Microservices

Many modern software applications are built with a microservices architecture, and Node.js has become the runtime environment of choice for many developers building microservices. However, working with logs in microservices—especially as complex applications comprise dozens (or more) microservices—is a challenging and cumbersome endeavor. Logging is a crucial part of building and maintaining an application.

Understand Your Kubernetes Telemetry Data in Less Than 5 Minutes: Try Mezmo's New Welcome Pipeline

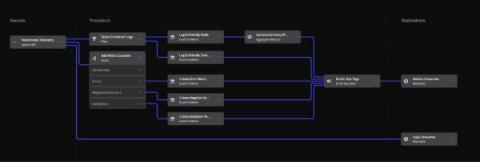
Most vendor trials take quite a bit of effort and time. Now, with Mezmo’s new Welcome Pipeline, you can get results with your Kubernetes telemetry data in just a couple of minutes. But first, let’s discuss why Kubernetes data is such a challenge, and then we’ll overview the steps.

What to Do When You Have 1000+ Fields?

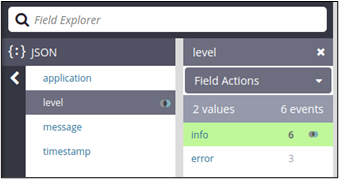
So you have been adding more and more logs to your Graylog instance, gathering up your server, network, application logs, and throwing in anything else you can think of. This is exactly what Graylog is designed for, to collect all the logs and have them ready for you to search through in one place. Unfortunately, during your administration of Graylog, you go to the System -> Overview screen and see the big bad red box, saying you are having indexing failures.

The 12 Cats of Observability

On the surface, business-critical IT infrastructure and cats may not seem like they have a lot in common. But they’re way more alike than you might think. Our feline friends contain multitudes, as any cat parent will tell you. They’re complex and can sometimes drive you up a wall. But once they warm up to you—and you warm up to them—the joys and benefits of having them in your life outweigh just about everything. Sounds a lot like technology, right?

Your Self-Managed Journey to Digital Resilience

If you were one of the thousands of Splunk customers who joined us this year at.conf23, you heard our CEO Gary Steele say that Splunk's mission is to help you be digitally resilient. (And don't worry if you couldn't join us, because you can catch the keynote replays.) But what is digital resilience and how do you attain it?

Failure Metrics & KPIs for IT Systems

The game in enterprise IT is this: delivering amazing services to your customers while also reducing costs. That means the time it takes to respond to an incident is critical. Incidents can ruin service delivery and destroy your budget. Certain incidents almost surely deliver a poor customer experience. Response times, you hear? Yep, we’re talking about MTTR, but that’s not all.

Auto-instrumentation of .NET applications with OpenTelemetry

In the fast-paced universe of software development, especially in the cloud-native realm, DevOps and SRE teams are increasingly emerging as essential partners in application stability and growth. DevOps engineers continuously optimize software delivery, while SRE teams act as the stewards of application reliability, scalability, and top-tier performance. The challenge?