Operations | Monitoring | ITSM | DevOps | Cloud

Latest News

The Cribl Packs Dispensary - A Place to Share and Care

Building Packs is good. Sharing Packs is better! The Cribl Pack Dispensary is the go-to place to find, install and share Cribl Packs. What are Packs? A Cribl Pack is a collection of pre-built routes, pipelines, data samples, and knowledge objects. Packs enable sharing of best-practice configurations that route, shape, reduce and enrich the log source, Palo Alto Networks logs for example. And it’s the quickest, easiest way to get started with Stream and Edge supports Packs too.

PostgreSQL Logging Configuration Explained: How to Enable Database Logs

PostgreSQL is an open-source relational database management system that’s been utilized in continuous development and production for 30 years now. Nearly all the big tech companies use PostgreSQL, as it is one of the most reliable, battle-tested relational database systems today. PostgreSQL is a critical point in your infrastructure, as it stores all of your data. This makes visibility mandatory, which in turn means you have to understand how logging works in PostgreSQL.

LogRhythm Cloud: Too Little, Too Late

Over the last 12 months, we’ve seen growing momentum around several disruptive trends in the cloud SIEM market. One of the most pervasive and obvious developments for Logz.io is the frequency with which we encounter customers seeking to replace dated and legacy on-premises SIEMs with a solution such as our Cloud SIEM. The traditional provider that comes up most often is LogRhythm—for numerous different reasons.

Top Prometheus Interview Questions

If you are an engineer searching for a new role that involves a high level of knowledge on the monitoring stack Prometheus then you will likely wish to brush up on your knowledge of Prometheus ahead of your interview. In this guide, you will find a list of the most popular questions that are most likely to be asked to candidates looking to use Prometheus as part of their daily monitoring stack within their next role.

Logit.io Launches Further Improvements To Alerting & Monitoring

We are happy to announce today that we have launched further improvements to the Logit.io platform’s alerting and monitoring features. This latest release of the Logit.io platform offers our users an improved workflow to assist with their productivity on the platform as well as a more updated intuitive user interface (UI).

More support for structured logs in new version of Go logging library

The new version of the Google logging client library for Go has been released. Version 1.5 adds new features and bug fixes including new structured logging capabilities that complete last year's effort to enrich structured logging support in Google logging client libraries. Here are few of the new features in v1.5: Let's look into each closer.

Centralized Log Management for Network Monitoring

It’s been a long few years for your IT department. In the span of one month, you had to make sure that all employees and contractors could work remotely. This meant giving everyone access to all cloud resources and ensuring uptime. Then, you needed to start securing access. Now, you need to shore up all your security as the phrase “zero trust architecture” has recently entered conversations with leadership.

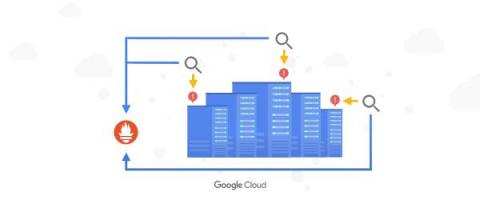
Cloud Monitoring metrics, now in Managed Service for Prometheus

According to a recent CNCF survey, 86% of the cloud native community reports that they use Prometheus for observability. As Prometheus becomes more of a standard, an increasing number of developers are becoming fluent in PromQL, Prometheus’ built-in query language. While it is a powerful, flexible, and expressive query language, PromQL is typically only able to query Prometheus time series data.

Application Snapshots: A Valuable Observability Signal for Developers

Monitoring is often not the first thing on the mind of the modern developer. Yet, it’s necessary at many points of the software development lifecycle, including: before deprecating an API, before launching a new feature, after launching the feature, and more. In fact, monitoring needs can vary much more than the classic Ops monitoring.