Operations | Monitoring | ITSM | DevOps | Cloud

Latest News

An Introduction to Synthetic Monitoring: Monitor the Uptime of your App and Critical Flows

In a world where the customer’s digital experience is critical to business outcomes, it is crucial to understand how our applications are behaving. As businesses increasingly rely on the performance and availability of revenue-generating applications, the tolerance for downtime and slow response times has plummeted – so the response to production issues must be quick and effective.

Improve Website Performance by Checking Logs

In the early days of log analysis, application developers would use their logging libraries to write logs to files stored on a disk. After years of relying on those libraries, they found that they were unable to monitor the performance of their applications anymore because they didn’t understand the way their logging libraries worked. This led to a shift from using log files stored on a disk to using Syslog.

Logit.io Announces The General Availability of OpenSearch

You may remember from our previous update (published August 2nd 2021) that we announced our initial support for the beta version of OpenSearch, well today we are pleased to announce that we’ve recently launched OpenSearch & OpenSearch dashboards 2.0.0 available for all platform users to use from today.

Kubernetes Security Best Practices

As the container orchestration platform of choice for many enterprises, Kubernetes (or K8s, as it’s often written) is an obvious target for cybercriminals. In its early days, the sheer complexity of managing your own Kubernetes deployment meant it was easy to miss security flaws and introduce loopholes. Now that the platform has evolved and been managed, Kubernetes services are available from all major cloud vendors, and Kubernetes security best practices have been developed and defined.

Time Series Forecasting Use Cases and Anomaly Detection

Wouldn’t it be great to peek into the future and find answers to the problems that you’re facing today? This may sound like science fiction, but many companies currently possess this capability, and they are creating strategies around it to strengthen their monitoring and analytical capabilities. One way is time series forecasting, a statistical method. You can take advantage of the insights of time series forecasting by using techniques like anomaly detection to gain.

Using the Density Function for Adaptive Thresholding with Splunk

It’s 3PM on a Friday, and your day is winding down. Suddenly, you get an urgent email from your boss asking you to set up an alert for monitoring volume. You consider this an easy task. You set a hard threshold for what you think is a low volume based on the last four hours of incoming data.

Monitor your IoT devices at scale with Datadog Log Management

The Internet of Things (IoT) can be found in a diverse range of devices, including fleets of autonomous vehicles, automobiles, planes, electric charging stations, and voice controllers. These devices are embedded with gateways, electronics, actuators, platform hubs, and cloud-service connectivity, enabling them to exchange data across the physical, network, and application layers that constitute IoT architecture.

Dashboard Studio: More Maps & More Interactivity

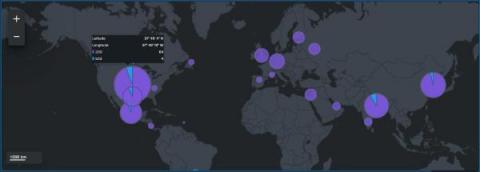
In Splunk Cloud Platform 8.2.2203, we're continuing to expand on interactivity capabilities and visualizations for Dashboard Studio. We've added the ability to use search results and job metadata as tokens, and pass tokens through drilldowns to other dashboards. There is a new map visualization for cluster maps and UI to match strings for dynamic coloring. And finally, we've included the ability to set a Studio dashboard as your home dashboard.