Operations | Monitoring | ITSM | DevOps | Cloud
Latest News
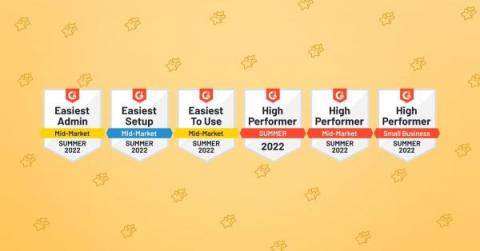
Logz.io Cloud SIEM Honored with 6 Summer 2022 G2 Badges!
For Summer 2022, Logz.io is thrilled to have earned six G2 Research Badges for our Cloud SIEM offering. These honors highlighted the ease of setup, ease of use, and high performance that we provide our customers through Cloud SIEM. G2 Research is a tech marketplace where people can discover, review, and manage the software they need to reach their potential.
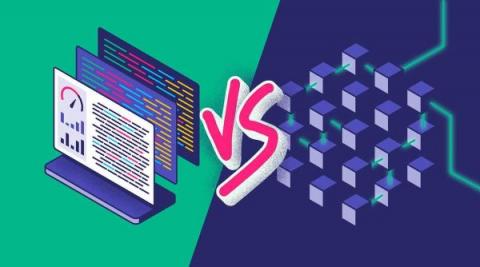
Tracing vs. Logging: What You Need To Know
Log tracking, trace log, or logging traces… Although these three terms are easy to interchange (the wordplay certainly doesn’t help!), compare tracing vs. logging, and you’ll find they are quite distinct. Logs, traces, and metrics are the three pillars of observability, and they all work together to measure application performance effectively. Let’s first understand what logging is.
The Next Frontier for Observability: Data Ownership with OpenTelemetry
Observability is a mindset that lets you use data to answer questions about business processes. In short, collecting as much data as possible from the components of your business — including applications and key business metrics — then using an AI-powered tool to help consolidate and make sense of this huge volume of data gives you observability into your business. Having observability for your business and applications lets you make smarter decisions, faster.
Status Pages: The Ultimate Guide
Status pages have become the end-users window into your team’s operations. Companies with status pages are doing the right thing for their users — building in some transparency while mitigating frustration and support contact. For the benefits of status pages to pay off, organizations need to treat them as something more than active wiki-pages run by support.
How to improve uptime with real-time monitoring, Grafana dashboards, and Grafana Loki: Inside Dish Network's observability stack
Dish Network is on a mission to connect people and things by changing the way the world communicates. With products ranging from Dish and Sling TV to retail wireless services and 5G networks, monitoring their satellite communications equipment is mission critical to maintaining extreme uptime for Dish’s 20 million customers across the United States.
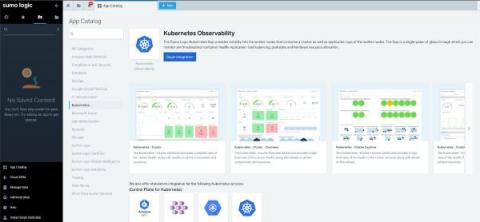
How to gain Kubernetes visibility in just a few clicks
What is Tracing? Everything You Need to Know
Tracing, or more specifically distributed tracing or distributed request tracing, is the ability to follow a request through a system, joining the dots between all the individual system calls required to service a particular request. Although tracing logs have been around for some time, the trend toward distributed architectures, microservices, and containerization has elevated it from nice-to-have status to an essential piece of the observability puzzle.
Logging in Python: A Developer's Guide
Have you ever had a tough time debugging your Python code? If yes, learning how to set up logging in Python can help you streamline your debugging workflow. As a beginner programmer, you’ll have likely used the print() statement—to print out certain values across runs of your program—to check if the code is working as expected. Using print() statements to debug could work fine for smaller Python programs.
How Does Observability Help an Organization Move the Needle?
If you’re new to the concept or just trying to keep up with the conversation, Gartner defines Observability as the evolution of monitoring into a process that offers insight into digital business applications, speeds innovation and enhances customer experience. Some folks think that Observability is a new buzzword, but in fact the term was coined in 1960 by Rudolf E. Kalman, a Hungarian-American engineer.


