Operations | Monitoring | ITSM | DevOps | Cloud

Latest News

How to Monitor Logs Guide With Recommended Automated Tools

Log monitoring is a practice used by IT administrators to organize, analyze, and understand a network’s performance. All network devices, including applications and hardware, create logs as they perform operations. Logs are like a device’s diary—they record every event and its critical information like user IP address, date and time, request time, and more.

OpenSearch Tutorial: Getting Started with Install and Configuration

OpenSearch is a community response to the recent relicensing of Elasticsearch as a non-Open Source platform. AWS, Logz.io, and a number of partners have been working for months not only to make this merely compatible with Elasticsearch as a functional replacement, but also seeking to create an independent project roadmap.

Secure your deployments on Elastic Cloud with Azure Private Link

We are pleased to announce the general availability of the Azure Private Link integration with Elastic Cloud. Azure Private Link provides private connectivity between your VNET (Virtual Network) and other Azure resources. Private Link simplifies your cloud network architecture and eliminates data exposure to the public internet by routing your data to private Azure service endpoints.

Announcing WP Activity Log Integration

With over 40% of websites powered by WordPress, there’s a good chance you or someone in your company is using it to update content or manage websites. This is why we’re excited to announce an integration with WP Activity Log—a comprehensive WordPress activity log plug-in—and SolarWinds® Papertrail™.

Dashboards on Cloud Monitoring made easier with samples

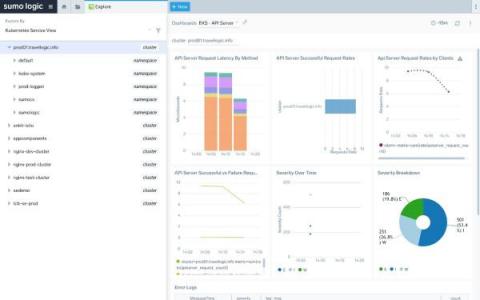
Setting up Cloud Monitoring dashboards for your team can be time consuming because every team's needs are different. Picking the right metrics, using the right visualizations to represent these metrics, deciding what metrics can go on the same chart, and determining the right pre-processing steps for metrics requires background and experience that may not yet exist among your development and operations teams.

Introducing Logz.io's New Lookz!

When Logz.io was founded in 2015, we set out to simplify logging with the ELK Stack by delivering Elasticsearch and Kibana as a managed cloud service. But logs only tell part of the story – DevOps teams also need metric and trace data to better monitor the health and performance of their environment and quickly pinpoint the root cause of new problems. Importantly, using multiple tools to collect and analyze this data adds complexity and extra work.

Introducing Live Tail

At observIQ, we pride ourselves on delivering simple and powerful functionalities, quickly. We’re excited to announce the addition of Live Tail to the observIQ featureset. Live Tail emulates the terminal experience, giving you the ability to analyze, visualize and debug live – all in a single place. Never be worried about what the outcome of your deployment will be because Live Tail lets you troubleshoot, react and reassess issues in your deployment in real-time.

What We Learned About Enterprise Cloud Services From the 2021 Azure Outage

Azure, AWS, and GCP cloud services are invaluable to their enterprise customers. When providers like Microsoft are hit with DNS issues or other errors that lead to downtime, it has huge ramifications for their users. The recent Azure cloud services outage was a good example of that. In this post, we’ll look at that outage and examine what it can teach us about enterprise cloud services and how we can reduce risk for our own applications.

Monitoring Kubernetes with the Elastic Stack using Prometheus and Fluentd

Kubernetes is an open source container orchestration system for automating computer application deployment, scaling, and management, and seems to have established itself as the de facto standard in this area these days. The shift from monolithic applications to microservices brought by Kubernetes has enabled faster deployment, where dynamic environments become commonplace. But on the other hand, this has made monitoring applications and their underpinning infrastructure more complex.

Art of Data: Bringing Data to Esports

You may have seen the announcement that Splunk and McLaren Racing have expanded their partnership, which sees Splunk as an Official Global Partner of the McLaren Shadow Esports team and the Logitech McLaren G Challenge. As a budding Esports fan and data enthusiast, it’s really exciting to see these two worlds collaborate and accelerate the virtual racing experience.