Operations | Monitoring | ITSM | DevOps | Cloud
Latest News
Instrumentation for C# .NET Apps with OpenTelemetry
OpenTelemetry is the recommended path today for instrumenting applications with tracing in a standard, vendor-agnostic and future-proof way. In fact, OpenTelemetry (nicknamed OTEL) encompasses all three pillars of observability: tracing, metrics, and logs. The tracing element of the specification is now stable with the rest following. This is innovative stuff! You can read more on OpenTelemetry and the current release state on this guide.
Announcing the Logz.io Search Bar
Engineering teams hoping to gain full-stack observability into their environment need access to the relevant logs, metrics, and traces generated by their cloud infrastructure and applications. Accessing the relevant data quickly is essential – not just because it is more convenient, but because faster engineers are also business-critical for many organizations.
5 Weird Use Cases for Log Management
We’re all familiar with the typical use cases for log management, such as monitoring cloud infrastructures, development environments, and local IT infrastructure. So we thought it would be fun to cover some of the less usual, more wild use cases for log management, just to show that log management tools are more versatile, and more interesting, than they may seem. If any of these use cases look too interesting to ignore, let us know and we can do a full article on them!
7 JSON Logging Tips That You Can Implement
When teams begin to analyze their logs, they almost immediately run into a problem and they’ll need some JSON logging tips to overcome them. Logs are naturally unstructured. This means that if you want to visualize or analyze your logs, you are forced to deal with many potential variations. You can eliminate this problem by logging out invalid JSON and setting the foundation for log-driven observability across your applications.
The Benefits of Structuring Logs in a Standardized Format
Image via Pixabay As any developer or IT professional will tell you, when systems experience issues, logs are often invaluable. When implemented and leveraged effectively, the data produced by logging can assist DevOps teams in more quickly identifying occurrences of problems within a system. Moreover, they can prove helpful in enabling incident responders to isolate the root cause of the problem efficiently. With that being the case, maximizing the value of log data is vital.
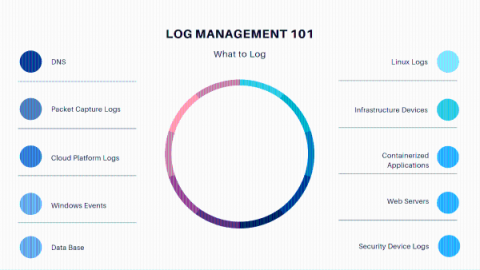
Log Management 101: Log Sources to Monitor
Log management software gives the primary diagnostic data in your applications’ development, deployment, and maintenance. However, choosing the log sources to log and monitor could often be a daunting task. The primary cause of concern in monitoring all sources is the high price tag that many SIEM tools in the market charge based on the number of users and sources ingesting logs. At observIQ, we offer unlimited users and sources.
Introduction to Custom Metrics in Java with Logz.io RemoteWrite SDK
We just announced the creation of a new RemoteWrite SDK to support custom metrics from applications using several different languages. This tutorial will give a quick rundown of how to use the Java SDK. This SDK – like the others – is completely free and open source, and is meant to apply to any output destination, not just Logz.io.
Announcing LogDNA Agent 3.3 GA: Improved Performance for Linux Support
We’re excited to announce the general availability of the LogDNA Agent 3.3, which introduces Linux and ARM64 support to our Rust Agent. This new support in our Rust Agent provides improved performance and enables a few features previously only available for our Kubernetes customers, such as various configurations within the Agent and the ability to run as a non-root user. Additionally, we have added in Prometheus Metrics that help provide insights into your Agent.
IoT Data With LogDNA
Consider the following question: Why do most teams face pressure to rethink traditional logging and observability approaches? Asking this question to most engineers would likely result in answers centered on the challenges posed by microservices apps. Because microservices are more complex than monoliths and involve more moving parts, they require more sophisticated, granular log collection, correlation, and analysis.


