Operations | Monitoring | ITSM | DevOps | Cloud

Latest News

Essential Observability Techniques for Continuous Delivery

Observability is an indispensable concept in continuous delivery, but it can be a little bewildering. Luckily for us, there are a number of tools and techniques to make our job easier! One way to aid in improving observability in a continuous delivery environment is by monitoring and analyzing key metrics from builds and deploys. With tools such as Prometheus and their integrations into CI/CD pipelines, gathering and analysis of metrics is simple. Tracking these things early on is essential.

Full Observability with Your Node.js App

Javascript is a pretty prolific programming language, used daily by people visiting any number of websites and web applications. NodeJS, it’s server-side version, is also used all over the place. You’ll find it deployed as full application stacks to functions in things like AWS Lambda, or even as IoT processes with things like Johnny Five. So when we think about Observability in the context of a nodejs stack, how do we set it up and get the information flowing?

Planning Your Log Collection

Whether you are planning to use Graylog for security and threat hunting, IT Operations analysis and reporting, or any other use case, getting your logs into Graylog is essential. The process of log collection is sometimes a daunting task, especially if you are planning to collect massive amounts of data. But if you take a minute to answer some key questions before you begin, you can transform the log collection task from daunting to smooth sailing. Here we go with the questions...

Enhancing the DevOps Experience on Kubernetes with Logging

Keeping track of what’s going on in Kubernetes isn’t easy. It’s an environment where things move quickly, individual containers come and go, and a large number of independent processes involving separate users may all be happening at the same time. Container-based systems are by their nature optimized for rapid, efficient response to a heavy load of requests from multiple users in a highly abstracted environment and not for high-visibility, real-time monitoring.

Splunk Recognized as Value Leader in EMA Radar Report: AIOps, A Guide for Investing in Innovation

Splunk has been recognized as a Value Leader in EMA’s latest research, Radar Report: AIOps, A Guide for Investing in Innovation. Vendors were evaluated across three categories, with Splunk listed as a Value Leader in both ‘Incident, Performance, and Availability Management’ and ‘Business Impact and IT-To-Business Alignment’, as well as Strong Value in ‘Change Impact and Capacity Optimization’.

All the non-technical advantages of Loki: reduce costs, streamline operations, build better teams

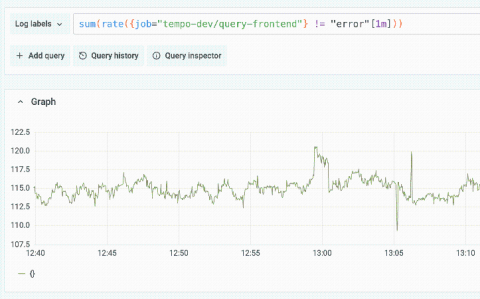
Hi, I’m Owen, one of the Loki maintainers, and I’m putting proverbial pen to paper to convince you why Loki is important. And this isn’t because it scales (it does) or because I work at Grafana Labs (I do). It’s because of the oft-overlooked and underrepresented organizational benefits. Organizational benefits?! What is this, some sort of cult? Why are you avoiding the technicals? Whoa, whoa, whoa. Now, hold on. The technicals are still valid.

Secure Your Endpoints with ESET and Logz.io

Watching too many movies might give you the impression that cyber attacks are launched by well-funded masterminds able to control the internet at their whim. But really, successful attacks can be as simple as disguising some malicious software as a link to an often-used site, and tricking people into clicking it, known as phishing. The result is that many cyber attacks are carried out by taking advantage of unsuspecting end users.

Are you on top of newly introduced errors in your CI/CD releases?

Log files are infamous for being “noisy”. Without the right management solution, trying to find a specific piece of information or using them to reproduce a critical error is a complex undertaking. If you’re working with CI/CD, how do you attribute new errors to a particular release? How do you investigate those errors and make sure that your customers aren’t being impacted? Faster releases mean shorter development and testing cycles before new code reaches production.

Java Logging: Best Practices for Success with your Java Application

Java is used by at least 7.6 Million developers worldwide. Java logging has been a staple of the Java platform since day one, boasting extensive, resourceful documentation and rich API’s. The cornerstone of monitoring your application is efficient and widespread logging. At Coralogix, we know that logs have become one of the most important components of a modern monitoring function.

Enhanced Data Analysis and Insights with Catchpoint and Splunk

Digital experience monitoring is only effective if incidents are detected immediately and the data aids in quick root cause analysis and resolution. To track the availability, reachability, performance, and reliability of each component in the application delivery chain, different teams within an organization, use multiple tools. Each of these tools generate huge volumes of data that can make it difficult to gain any meaningful insight or even to correlate relevant KPIs.