Operations | Monitoring | ITSM | DevOps | Cloud

Latest News

How to collect and manage all of your multi-line logs

Multi-line logs such as stack traces give you lots of very valuable information for debugging and troubleshooting application problems. But, as anyone who has tried knows, it can be a challenge to collect stack traces and other multi-line logs so that you can easily parse, search, and use them to identify problems. This is because, without proper configuration, log management services and tools do not treat multi-line logs as a single event.

What's New in Logz.io - September 2019

We hope you guys managed to rest over the summer because we sure didn’t. Our engineering team has been working hard on developing new features and enhancements, some of which may have flown under your radar. To help you catch up, here’s a short recap of the latest and greatest from Logz.io with relevant referrals to read up more about the different items.

Avoiding death by external side effects - a tale of Kafka Streams

At Coralogix, we strive to ensure that our customers get a stable, real-time service at scale. As part of this commitment, we are constantly improving our data ingestion pipeline resiliency and performance. Coralogix ingests messages at extremely high rates — up to tens of billions of messages per day. Every one of these records needs to go through our entire pipeline at near real-time rates: validation, parsing, classification, and ingestion to Elasticsearch.

Archiving Log Files: Feature Guide for File Storage and Archiving

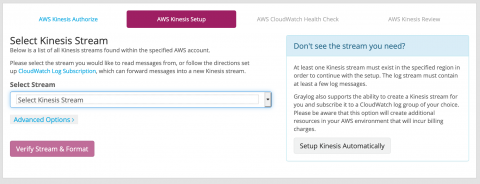
Every organization that handles large volumes of data should implement an archiving system to separate active from inactive data, including log files. With recent changes in data laws in the EU and the growing needs for log archiving, finding a quality file storage and archiving solution is more important than ever. We will discuss the reasons for archiving data and show you how to successfully store logs and use the Archive feature in Graylog Enterprise.

The Power of Audit Logs

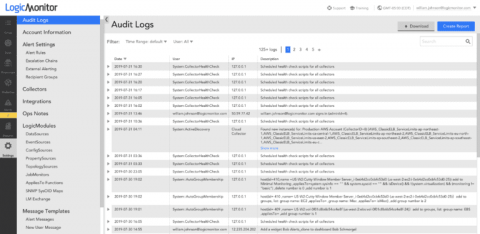
If you’re a LogicMonitor customer, the platform’s Audit Logs may seem like a rudimentary means to track user actions, but they can actually be a powerful tool for troubleshooting and getting historical data within your portal. For instance, let’s say you notice that the alerting for a particular device group has been unexpectedly disabled.

Introducing Scheduled Reporting

We’re happy to announce the release of Logz.io Reports — an easy way to set up scheduled reporting for both operational and security use cases. Kibana dashboards provide you with a window into your environment, visualizing the different signals being tracked in a beautiful mix of graphs, charts, and maps. Often used in times of crisis and as the starting point for an investigation, dashboards can also be useful as a static reporting tool for multiple use cases.

Objectives-Driven Observability

Today I wanted to write about something that’s been on my mind for the last few months. The industry spends quite a bit of time talking about observability these days and something’s been, somewhat vaguely, bothering me about it. So about a week or so ago, I spent some time figuring out what was bothering me and had some insights I would like to share.