Operations | Monitoring | ITSM | DevOps | Cloud

Latest News

What is IT Operations Analytics (ITOA)?

In the world of information technology, data has become the fundamental currency that holds the highest value. IT Operations Analytics (ITOA) represents one of the largest and richest sources of fresh and actionable data. Many automated tools can be used to make sense of all the information that comes from day-to-day IT operations, from log to agent to wire data.

What to do when you lose logs with Kubernetes

Kubernetes has fundamentally changed the way we manage our production environments. The ability to quickly bring up infrastructure on demand is a beautiful thing, but along with it brings some complexity, especially when it comes to logging. Logging is always an important part of maintaining a solid running infrastructure, but even more so with Kubernetes. Because Kubernetes clusters are constantly being spun up, spun down, always in flux, making sure logging functions correctly is critical.

A Basic Guide To Elasticsearch Aggregations

Elasticsearch Aggregations provide you with the ability to group and perform calculations and statistics (such as sums and averages) on your data by using a simple search query. An aggregation can be viewed as a working unit that builds analytical information across a set of documents. Using aggregations, you can extract the data you want by running the GET method in Kibana UI’s Dev Tools. You can also use CURL or APIs in your code.

Challenges in Monitoring Hybrid Clouds

As discussed in our blog post the Rise of the Hybrid Cloud the dramatic growth of hybrid infrastructures is being driven by benefits such as enhanced flexibility, cost optimization opportunities, and support for the agile DevOps culture. But hybrid clouds also come with their challenges, such as determining how to consistently apply security and compliance processes and how to avoid performance issues resulting from the differences between private and public cloud SLAs.

Peering Inside the Container: How to Work with Docker Logs

We live in a containerized world, and traditional monitoring and logging are being forever changed. The dynamic and ephemeral nature of containers creates new logging challenges. Docker addresses these in some ways. Docker Engine provides various logging drivers that determine where logs are sent or written to. The default driver for Docker logs is “json-file,” which writes the logs to local files on the Docker host in json format.

Sematext Experience is here

Ever heard the expression “A picture is worth a thousand words”, well with Sematext Experience we want you to have a picture of the thousand words your customers want to tell you, but usually don’t. At Sematext, we’ve learned over time that we cannot count on customers or visitors on our website to tell us about issues they encounter while using our product or visiting our webpage.

How to Read, Search, and Analyze AWS CloudTrail Logs

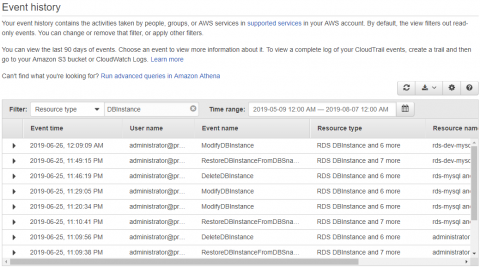
In a recent post, we talked about AWS CloudTrail and saw how CloudTrail can capture histories of every API call made to any resource or service in an AWS account. These event logs can be invaluable for auditing, compliance, and governance. We also saw where CloudTrail logs are saved and how they are structured. Enabling a CloudTrail in your AWS account is only half the task.

Enhancing Support for Zeek (Bro) in Logz.io Security Analytics

We’re happy to announce official support for Zeek in Logz.io Security Analytics for easier security monitoring! Logz.io Security Analytics provides a unified platform for security and operations designed for cloud and DevOps environments. It’s built on top of Logz.io’s enterprise-grade ELK Stack and is extremely easy to set up and integrate with.

Do you, take Open Distro, for Elasticsearch? I do

CHAOSSEARCH is building a new standard (a new category) in data analytics. Beyond the cost and complexity of Warehousing, Hadoop, or even Elasticsearch solutions. CHAOSSEARCH is a new kind of big data platform that delivers both search and analytics at a price and simplicity yet experienced. At CHAOS, we are primarily focused on transforming object storage (such as S3) into the first multi-model database, where the user provides read-only access to their S3 storage and CHAOS provides the rest.

How Grafana Labs Effectively Pairs Loki and Kubernetes Events

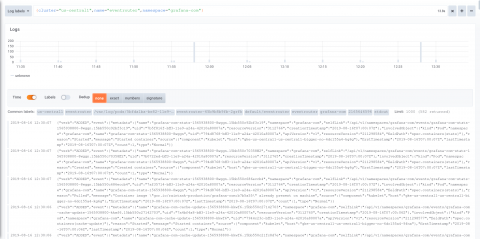
As we’ve rolled out Loki internally at Grafana Labs, we wanted logs beyond just simple applications. Specifically while debugging outages due to config, Kubernetes, or node restarts, we’ve found Kubernetes events to be super useful. The Kubernetes events feature allows you to see all of the changes in a cluster, and you can get a simple overview by just retrieving them: This also captures when nodes go unresponsive and when a pod has been killed along with the reason.