Operations | Monitoring | ITSM | DevOps | Cloud

Latest News

Why is Log Management Important

Ever since humankind developed the ability to write, much of our progress has been made thanks to recording and using data. In ages long past, notes were made on the production and gathering of resources, the exact number of available soldiers and other important personnel, and were compiled and stored by hand. Because of this documentation method, important information was also prone to being misplaced, lost, or even mishandled.

Container Logging & Devops: the Future of Kubernetes Integration

I hosted a webinar where I covered why logging is important, how to choose a logging provider. And then shared our experience of setting up logging on Kubernetes containers, the Kubernetes logging framework and the logging best practices we’ve implemented internally and supported our customers who run Kubernetes in production.

Setting Up Application Performance Monitoring with the ELK Stack and Logz.io

Application Performance Monitoring, aka APM, is one of the most common methods used by engineers today to measure the availability, response times and behavior of applications and services. There are a variety of APM solutions in the market but if you’re familiar with the ELK Stack or are a Logz.io user, this article describes using a relatively new open source-based solution — Elastic APM.

AWS GuardDuty Monitoring with Logz.io Security Analytics and the ELK Stack

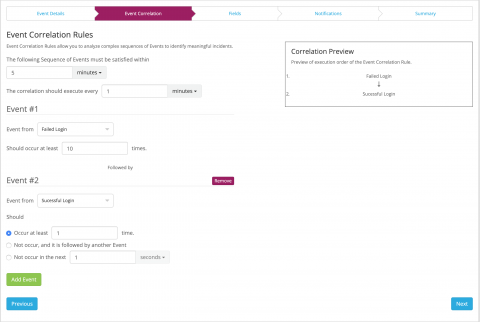
Last month, we announced Logz.io Security Analytics — a security app built on top of the ELK Stack, offering out-of-the-box security features such as threat intelligence, correlation, and premade integrations and dashboards. In this article, I’d like to show an example of using both the ELK Stack and Logz.io Security Analytics to secure an AWS environment.

Server Log Files in a Nutshell

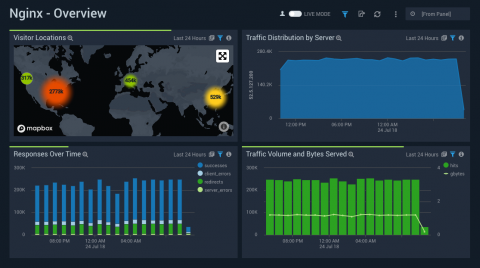
Servers take a lot of requests daily, we know that…We also know that the server responds instantly. But who makes the request? What do they want, and what exactly are they looking for? Where do these visitors come from? How often they are making a request: once a month, once a day, almost every minute? Well, answers to these, and potentially a lot more questions, can be found in a single place - the server log file.

Introducing Custom Parsing on LogDNA: A dead simple way to define your own log parsing rules

We’re excited to announce that LogDNA’s built-in log parser offers custom parsing, now available in beta. This means you can now use our step-by-step wizard to wrangle non-standard log formats and run custom transformations on your logs, allowing you to easily search and graph log lines that were previously off limits. The best part is, it’s a simple three step process: search, extract, validate… done!

SLF4J: 10 Reasons Why You Should Be Using It

One of the most important aspects of developing an efficient system is to have clean, helpful logs that will help you understand what errors are being triggered, and what information is being processed. When you are first creating an application, you might not know what logging framework will be most suitable for your future needs, or you could simply want your system to remain agnostic regarding the logging implementation to be used.

Near Real-Time Log Collection From Amazon S3 Storage

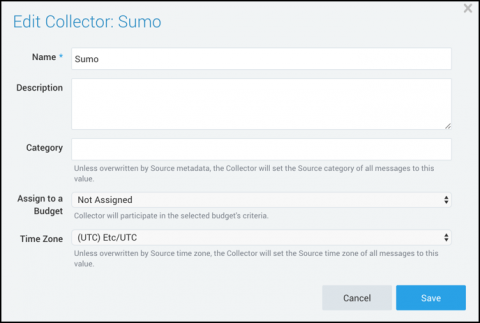
We are very excited to announce a new capability for our Amazon S3 sources. Until recently, the only method Sumo Logic used for discovering new data in an S3 bucket was periodic polling. However, with our new notification-based approach, users can now configure S3 sources such that Sumo Logic is notified immediately (via AWS SNS) whenever a new item is added to an S3 bucket, eliminating the need to wait for new objects to be discovered via periodic polling.