Operations | Monitoring | ITSM | DevOps | Cloud

Latest News

Announcing Graylog 3.1 Beta 3

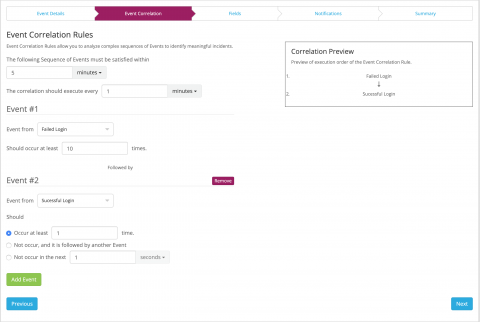
Today we are releasing the next public beta of Graylog v3.1. This release brings a whole new alerting and event system that provides more flexible alert conditions and event correlation based on the new search APIs that also power the views. In addition, some extended search capabilities introduced in Graylog Enterprise v3.0 are now available in the open source edition in preparation for unifying the various search features.

Introducing Breadcrumbs

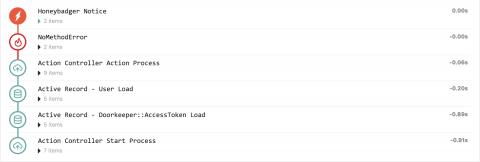
Have you ever dealt with an error in production, and no matter what you try, you can't replicate the issue on your development or staging environments? Often the next step is to gather more data by tossing a debug log at production. If you don't have a good way to correlate logs with a request it can be frustrating, especially during an incident. We added a feature to help, and it's called Breadcrumbs.

To SIEM or not to SIEM?

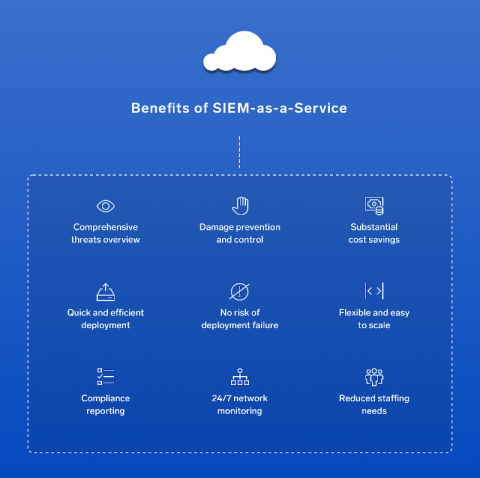
Not investing in Security Incident and Event Management solutions means you’re missing out on significant business benefits. SIEM detects and responds to security incidents in real time, which reduces the risk of noncompliance. It also helps realize greater value across all underlying security technology and systems. Reporting with SIEM is more comprehensive and less time-intensive, helping to reduce capital and operational costs through consolidation.

How to use Single Sign-On in LogDNA (SSO)

Single sign-on (SSO) is an authentication model designed to let users access different applications, services, and resources using a single set of credentials. Instead of having multiple user accounts for different applications, users are assigned a single centralized account that is used to authenticate with each application. This makes it more convenient for users to authenticate, while also making it easier for IT administrators to manage multiple accounts.

Loki's Path to GA: Adding Structure to Unstructured Logs

Launched at KubeCon North America last December, Loki is a Prometheus-inspired service that optimizes storage, search, and aggregation while making logs easy to explore natively in Grafana. Loki is designed to work easily both as microservices and as monoliths, and correlates logs and metrics to save users money. Less than a year later, Loki has almost 6,500 stars on GitHub and is now quickly approaching GA.

Kusto 101 - A Jumpstart Guide to KQL

This blog post is for anyone needing a jumpstart into the world of Kusto. Perhaps you’ve heard about Kusto and are just curious. Maybe you’re just starting to use Azure Monitor for your application monitoring. You might even be getting skilled up in anticipation of the new Squared Up for Azure release that will have KQL at its heart. Whatever your reason, set aside the next 10 minutes and we'll get you up to speed with KQL. Ready? KQL stands for Kusto Query Language.

Logging Istio with ELK and Logz.io

Load balancing, traffic management, authentication and authorization, service discovery — these are just some of the interactions taking place between microservices. Collectively called a “service mesh”, these interconnections can become an operations headache when handling large‑scale, complex applications. Istio seeks to reduce this complexity by providing engineers with an easy way to manage a service mesh.

How to Monitor Fastly Performance

In the last post, we talked about how Fastly, a content delivery network, provides a global infrastructure footprint to enterprises, and enables them to move apps and websites closer to their end users. Using Fastly CDN, they can serve content and deploy updates quickly, optimize web performance, and improve overall user experience. In this post, we will discuss how to collect, analyze, and monitor Fastly logs.

What is Logspout?

Logspout is an open source log router designed specifically for Docker container logs. If you’ve ever looked into log management for Docker, chances are you’ve heard of it. Logspout is a container that collects logs from all other containers running on the same host, then forwards them to a destination of your choice. This lets you send logs to an HTTP/S server, syslog server, or other endpoint without having to monitor files or modify your host systems.

Unify logs across data sources with Datadog's customizable naming convention

Log management solutions can make it easy to filter, aggregate, and analyze your log data. Whether you leverage JSON format or process your logs in order to extract attributes, you can slice and dice your logs using the information they provide such as timestamp, HTTP status code, or database user. But different technologies and data sources often label similar information differently, making it difficult to aggregate data across multiple sources.