Operations | Monitoring | ITSM | DevOps | Cloud

Latest News

Five reasons to choose Log360, part 5: Integrated compliance management

So far in this blog series, we’ve seen how Log360 is simple to get up and running, allows you to receive a central view of multiple environments, provides deep auditing capabilities across these environments, and comes with advanced security features to deal with all manner of security incidents. In the concluding post of this blog series, we’ll look at another highly essential component of SIEM solutions: integrated compliance management.

Monitor JavaScript console logs and user activity with Datadog

Monitoring backend issues is critical for ensuring that requests are handled in a timely manner, and validating that your services are accessible to users. But if you’re not tracking client-side errors and events to get visibility into the frontend, you won’t have any idea how often these issues prompt users to refresh the page—or worse, abandon your website altogether.

Loki's Path to GA: Loki-Canary Early Detection for Missing Logs

Launched at KubeCon North America last December, Loki is a Prometheus-inspired service that optimizes storage, search, and aggregation while making logs easy to explore natively in Grafana. Loki is designed to work easily both as microservices and as monoliths, and correlates logs and metrics to save users money. Less than a year later, Loki has almost 6,500 stars on GitHub and is now quickly approaching GA.

How to monitor NGINX logs

In part one of our introduction to NGINX “What is NGINX” , we went over the basic history of NGINX, the difference between Apache and NGINX, and why you would use NGINX over Apache in certain environments and web applications. Today we’ll be diving deeper into NGINX and going over topics such as web server performance, monitoring said performance, how to obtain and archive logs for deeper analysis, and how to even tell which web server you’re running on your environment.

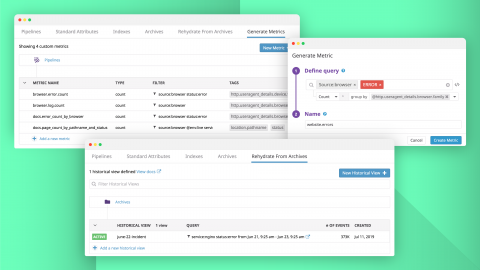
Introducing Metrics from Logs and Log Rehydration

As your application grows in size and complexity, it becomes increasingly difficult to manage the number of logs it generates and the cost of ingesting, processing, and analyzing them. Organizations often have little control over fluctuations in the volume of logs generated—and the resulting costs of collecting them—so they are forced to limit the number of logs generated by their applications, or to pre-filter logs before sending them to their log management platform.

Dash 2019: Guide to Datadog's newest announcements

At Dash 2019, we are excited to share a number of new products and features on the Datadog platform. With the addition of Network Performance Monitoring, Real User Monitoring, support for collecting browser logs, and single-pane-of-glass visibility for serverless environments, Datadog now provides even broader coverage of the modern application stack, from frontend to backend.

Pete's Top 3 New AWS Announcements from the Amazon NYC Summit

Only about four months to go before nearly 60,000 people descend on Las Vegas for the eighth annual AWS re:Invent user conference. However, that doesn’t mean that Amazon is going to embargo new service announcements until then. The recent AWS Summit in NYC looked more like a mini-re:Invent with nearly 12,000 people in attendance.

Deploying Redis with the ELK Stack

In a previous post, I explained the role Apache Kafka plays in production-grade ELK deployments, as a message broker and a transport layer deployed in front of Logstash. As I mentioned in that piece, Redis is another common option. I recently found out that it is even more popular than Kafka! Known for its flexibility, performance and wide language support, Redis is used both as a database and cache but also as a message broker.

Elasticsearch security: Authentication, Encryption, Backup

There’s no need to look outside the Elastic Stack for apps to ensure data protection. Basic Elasticsearch Security features are free and include a lot of functionality to help you prevent unauthorized access, preserve data integrity by encrypting communication between nodes, and maintain an audit trail on who did what to your stack and with the data it stores. From authentication to encryption and backup, Elasticsearch security covers everything that’s needed to safeguard your cluster.

3X Growth is Quite a Milestone, And It's Only the Beginning

When you start a company – or a third company as is the case for Lee and me – you start with a problem statement, a product you believe in, and a lot of hope. This means when growth goes as planned or exceeds expectations, you shouldn’t be surprised. This is what is supposed to happen. Great Product + Market Opportunity + Great Team = Successful Business. Intellectually, I know all this, but it is still exciting to see it come to fruition.