Operations | Monitoring | ITSM | DevOps | Cloud

Latest News

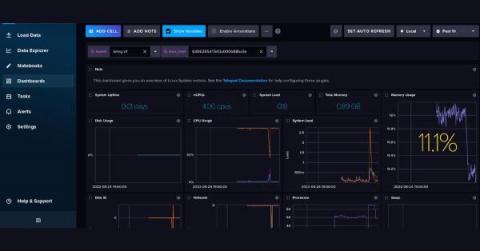
Real-Time Embedded Linux Observability with Pantavisor and InfluxDB

This article was originally published on HackMD and is reposted here with permission. Presently organizations are unable to monitor millions of embedded Linux devices in real-time. With so many different architectures and device types, aggregating telemetry and metrics and viewing that data in a centralized analysis tool is problematic. Onboarding embedded Linux devices into a telemetry service so that metrics can be easily observed is a significant challenge.

Sponsored Post

What Is the Controllability and Observability of Cloud Applications?

There are many computing resources used in different cloud application services to provide online software-as-a-service (SaaS). SaaS differs from traditional applications in that it works from a cloud computing environment. This means that both the application service as well as user data are being hosted by a cloud provider in the cloud. Therefore, the SaaS and data are accessible from anywhere as long as there's online access. This model provides a distinct advantage from a software perspective.

Introducing PrivateLink Support for Enterprise

Network topology can get very complicated in the cloud, especially when you’re sending data to external SaaS providers. You will likely need to configure gateways and firewalls and keep close tabs on those points of egress. However, if your infrastructure exists within AWS, there’s a much simpler way and that’s through an AWS PrivateLink endpoint.

Iterating on an OpenTelemetry Collector Deployment in Kubernetes

When you want to direct your observability data in a uniform fashion, you want to run an OpenTelemetry collector. If you have a Kubernetes cluster handy, that’s a useful place to run it. Helm is a quick way to get it running in Kubernetes; it encapsulates all the YAML object definitions that you need. OpenTelemetry publishes a Helm chart for the collector. When you install the OpenTelemetry collector with Helm, you’ll give it some configuration.

The Open Source Observability Adoption and Migration Curve

Open source monitoring and observability tools can be found in production all over the world – whether they’re being used by startups or entire enterprise development teams. DevOps, ITOps, and other technical teams rely on tools like Prometheus, Grafana, OpenSearch, OpenTelemetry, Jaeger, Nagios, Zabbix, Graphite, InfluxDB, and others to monitor and troubleshoot their cloud environment.

Your Business Requires a Resilient Internet

One of my initial surprises upon joining Catchpoint about five months ago was to do with how much confusion there is in the observability market. Every single vendor has almost the same message around ensuring a great digital experience for your customers or employees or both. Of course, these experiences are critical to get right, but for the most part many of these solutions, at best, help to ensure that sites are live and available, and that they are reachable by some users.

Everything You Need to Know About SolarWinds Observability-Our Transformational Subscription Service

Transformation is key to being at the forefront of the tech industry, and over the past two years, I’ve been excited to lead an outstanding team of developers and engineers as we’ve embarked on evolving our monitoring tools toward observability. With this in mind, we’re excited to announce two significant product releases today. The first is a completely new product offering and subscription service we call SolarWinds® Observability.

It's Time to Rethink Observability and Rethink SolarWinds

Everyone in the information technology industry understands “change” is guaranteed. People are creative and constantly striving to find more efficient ways to solve problems and more innovative ways to deliver services to consumers. But keeping up with the constant cloud and internet technology shifts and taking advantage of all the new capabilities is a harrowing task for digital organizations.

Find and Fix Bottlenecks in Your Gradle Builds With OpenTelemetry and Honeycomb

Today, I’d like to share with you a new community-contributed integration that helps you optimize and debug your Gradle builds. This new Gradle plugin is available today, is free to use, and you can use it immediately with a free Honeycomb account.