Operations | Monitoring | ITSM | DevOps | Cloud

Latest News

New Honeycomb Features Raise the Bar for What Observability Should Do for You

As long as humans have written software, we’ve needed to understand why our expectations (the logic we thought we wrote) don’t match reality (the logic being executed). To that end, we developed techniques to help measure reality—logging text strings, or capturing aggregated metrics—and persevered, seeking out newer and fancier logging or monitoring solutions over the intervening decades.

Introducing Honeycomb Service Map: A Dynamic, Interactive, and Actionable View of Your Entire Environment

Today, we're announcing the launch of Honeycomb Service Map. This isn't your grandparent's version of a service map. This feature reimagines what it is that you want to know or investigate when looking at visualizations of how your services communicate with one another.

Observing your application through the eyes of a user: A brand new synthetic monitoring experience is coming

Understanding if your applications are not just available but also functioning as expected is critical for any organization. Third-party dependencies and different end-user device types means that infrastructure monitoring and application observability alone are not enough to spot and minimize the impact of application anomalies.

Kentik Kube extends network observability to Kubernetes deployments

We’re excited to announce our beta launch of Kentik Kube, an industry-first solution that reveals how K8s traffic routes through an organization’s data center, cloud, and the internet. With this launch, Kentik can observe the entire network — on prem, in the cloud, on physical hardware or virtual machines, and anywhere in between.

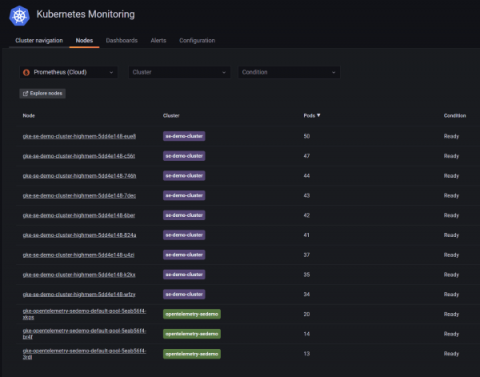
How to monitor the health and resource usage of Kubernetes nodes in Grafana Cloud

The spine is essential to perform every activity, like crawling, walking, or swimming. Just as the spine is necessary to enable these functions, your Kubernetes infrastructure needs a backbone to be efficient and effective. So if Kubernetes clusters act as the spine of your architecture, then Kubernetes nodes are like the vertebrae — they make up a Kubernetes cluster in the same way the vertebrae form the spinal column.

Announcing New GitHub Actions + Honeycomb Integration Guide

If you build or maintain code in GitHub, the Honeycomb Buildevents Action can help you optimize the performance of your build pipelines in GitHub Actions. This blog introduces you to the gha-buildevents Action and a new hands-on quickstart guide that will show you the inner workings of GitHub Actions workflows, the buildevents tool, and the Honeycomb UI.

Unified Observability: Announcing Kubernetes 360

Ask any cloud software team using Kubernetes (and most do); this powerful container orchestration technology is transformative, yet often truly challenging. There’s no question that Kubernetes has become the de-facto infrastructure for nearly any organization these days seeking to achieve business agility, developer autonomy and an internal structure that supports both the scale and simplicity required to maintain a full CI/CD and DevOps approach.

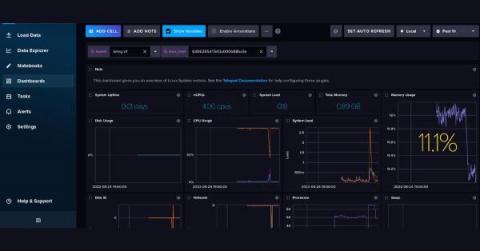
Real-Time Embedded Linux Observability with Pantavisor and InfluxDB

This article was originally published on HackMD and is reposted here with permission. Presently organizations are unable to monitor millions of embedded Linux devices in real-time. With so many different architectures and device types, aggregating telemetry and metrics and viewing that data in a centralized analysis tool is problematic. Onboarding embedded Linux devices into a telemetry service so that metrics can be easily observed is a significant challenge.

Grafana and Cilium: Deep eBPF-powered observability for Kubernetes and cloud native infrastructure

Today, Grafana Labs announced a strategic partnership with Isovalent, the creators of Cilium, to make it easy for platform and application teams to gain deep insights into the connectivity, security, and performance of the applications running on Kubernetes by leveraging the Grafana open source observability stack.