Operations | Monitoring | ITSM | DevOps | Cloud

Latest News

Observability vs Visibility - what's the difference?

Observability is a new term that’s slowly entered the mainstream over the last two years. Today it’s used in the context of monitoring, but it’s much more than that. And it also goes way beyond visibility. So, in this blog, we set out to explore observability vs visibility and find out, what’s the difference? In a recent podcast, our friends at Riverbed neatly explained that seeing and observing are two different things, and can be compared to hearing vs listening.

Observability Pipelines & AIOps can make IT Smarter

Enterprise data systems are like busy family households. You see a constant flow of activity to varying degrees from room to room. This activity includes people wandering, opening and closing doors. And then there are other streams constantly flowing through the household- electricity, water, Wi-Fi networks and more. In modern enterprises, the data deluge is a critical issue. While we take the complexity for granted in a household, such is not allowed in a connected enterprise.

Honeycomb + Squadcast Integration: Routing Incident Alerts Made Easy

Honeycomb is an application monitoring tool that helps DevOps and SRE teams to operate more efficiently by offering rich observability solutions and intuitive team collaboration. It helps understand complex relationships within your distributed systems and troubleshoot issues accordingly. Squadcast is an end-to-end incident response tool. Built with an SRE mindset, it streamlines all the incident response activities.

Observability versus monitoring in software development

To supervise the behavior of distributed applications and track the origin of service failures and downtime, developers often use traditional monitoring technologies and tools. However, this approach can fall short in its ability to measure the overall health of modern cloud-native architectures, which can span multiple hosting environments and encompass hundreds of microservices.

Observability for the Software Industry: Top 4 Challenges and How Monitoring Can Help

Software companies face more challenges than ever before to keep pace in an ever-evolving industry that requires innovation and reliability. The pressure to adapt to fast-moving and sophisticated technologies can easily create silos amongst teams and a lack of visibility within organizations. With legacy technology stacks and systems now in the rearview mirror, the focus of large-scale software development has shifted to ensuring standardization and distributed computing in a growingly serverless world.

Interview with Tom Granot - Developer Observability, KoolKits and Reliability

In preparation for the upcoming Developer Observability Masterclass we’re hosting at Lightrun with Thoughtworks and RedMonk, I sat down for a brief interview with Tom Granot – the Director of Developer Relations at Lightrun. Tom will MC the event as he did for the Developer Productivity Masterclass we ran back in December.

startSpan vs. startActiveSpan

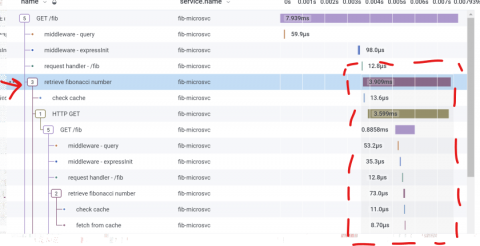
TL;DR: startSpan is easier and measures a duration. Use it if your work won’t create any subspans. startActiveSpan requires that you pass a callback for the work in the span, and then any spans created during that work will be children of this active span. I’m instrumenting a Node.js app with OpenTelemetry, and adding some custom instrumentation. For this important activity that I’m doing (let’s call it “retrieve number”), I’m creating a custom span.

Splunk Beyond Logs: Getting to Observability

Those of us of a certain age know well the saying “Nobody got fired for buying IBM.” In the log analysis and security world, we’ve become lucky to get to the point where people are saying “Nobody gets fired for buying Splunk.” Our success in these areas has definitely created a perception for what products Splunk has and what we can offer to our customers. The problem is that most of these perceptions don’t capture the full power of Splunk.