Operations | Monitoring | ITSM | DevOps | Cloud

Latest News

SRE + Honeycomb: Observability for Service Reliability

As a Customer Advocate, I talk to a lot of prospective Honeycomb users who want to understand how observability fits into their existing Site Reliability Engineering (SRE) practice. While I have enough of a familiarity with the discipline to get myself into trouble, I wanted to learn more about what SREs do in their day-to-day work so that I’d be better able to help them determine if Honeycomb is a good fit for their needs.

Interview with Honeycomb Engineer Chris Toshok: Dogfooding OpenTelemetry

At Honeycomb, we talk a lot about eating our own dogfood. Since we use Honeycomb to observe Honeycomb, we have many opportunities to try out UX changes ourselves before rolling them out to all of our users. UX doesn’t stop at the UI though! Developer experience matters too, especially when getting started with observability. We often get questions about the difference between using our Beeline SDKs compared with other integrations, especially OpenTelemetry (abbreviated “OTel”).

Observability in the Cloud-Native Age: Announcing the DevOps Pulse 2020

It’s that time of year again — the DevOps Pulse 2020 is here! Last year, nearly 1,000 engineers around the world provided their insights in the DevOps Pulse 2019 so we could get the community’s perspective on the growth and challenges associated with observability, cloud monitoring and more. As we discovered in last year’s DevOps Pulse, observability is still a major challenge for many organizations.

The difference between Event Logging and Tracing in Observability

I have been noticing that a lot of folks are often confused between event logging and tracing. In terms of building out a generic SD for devs to report on observability data, should Event APIs be distinct from Trace APIs? Is an Event just a single Trace Span ? If you look at Honeycomb’s implementation, an Event seems to be equivalent to a single span trace. The middleware wrapper creates a Honeycomb event in the request context as a span in the overall trace.

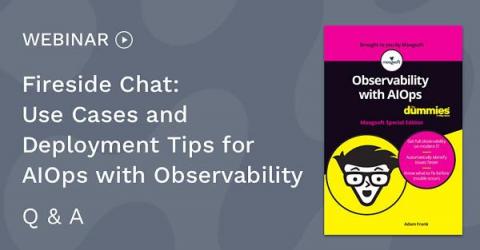
Your Burning Questions about AIOps and Observability Answered

A fireside chat to discuss use cases and deployment tips for AIOps with observability generated a stream of compelling questions from attendees, which the Moogsoft hosts answered with depth and expertise. Combining AIOps analysis with detailed observability data is key for DevOps and SRE teams to attain continuous service assurance, so Moogsoft just published a new ebook about this topic titled “Observability with AIOps For Dummies.”

How Value Stream Management Uses Observability to Optimize Flow

This is the second in a three-post series themed around Ops-led DevOps, where I explore the relationship between observability and a set of software delivery lifecycle practices that support the adoption of DevOps principles and the transition from project to product centric ways of working. I started with Site Reliability Engineering, here I consider Value Stream Management (VSM) and I will finish with Continuous Delivery. Defining VSM Forrester defines VSM as.

Get on the Right Track with Our Rails Integration!

Thanks to awesome contributions from the community and the hard work of our integrations team, the Honeycomb Rails integration comes with lots of great features out of the box. This post is an end-to-end tutorial to show you exactly the steps involved, from creating a new Honeycomb team to getting your data in and observing your app in production.

Alerting and anomaly detection for uptime and reliability

Being able to easily monitor the health of all your sites and services from multiple global locations is a powerful tool for site reliability. However, no one wants to sit and stare at a status dashboard all day. Naturally, teams want to be alerted when there is an issue. We can do that with alerting in Kibana. And when coupled with Elastic machine learning, alerts can be automatically generated from anomalies that are automatically detected. That’s the power of Elastic Observability.

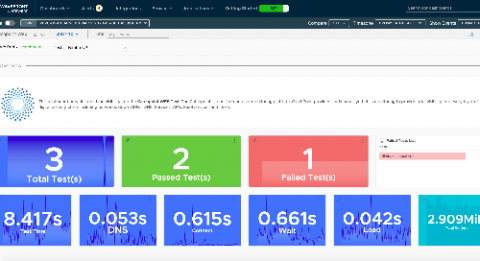
Digital Experience Monitoring with Tanzu Observability and Catchpoint Integration

In today’s highly digitized world, a seamless digital experience is an important aspect of driving customer behavior. As businesses adopt commercial cloud stacks to run applications, a lack of both control and visibility paired with increasing cloud complexity can create situations that blindside business owners.