Operations | Monitoring | ITSM | DevOps | Cloud

Latest News

Logz.io Upgrades App 360, Kubernetes 360 with AI Assistant, New Tracing Quickview

At Logz.io, we believe the future of observability will center on the rapid advancement of automation, innovations around artificial intelligence, and streamlining processes that currently remain far too complex. This is no different than many other areas of technology, but the opportunities in observability are vast, and we see all of these areas connecting and driving improvements to the Logz.io Open 360 platform.

Deep dive into observability of Messaging Queues with OpenTelemetry

Working in the observability and monitoring space for the last few years, we have had multiple users complain about the lack of detailed monitoring for messaging queues and Kafka in particular. Especially with the coming of instrumentation standards like OpenTelemetry, we thought there must a better way to solve this. We dived deeper into the problem and were trying to understand what better can be done here to make understanding and remediating issues in messaging systems much easier.

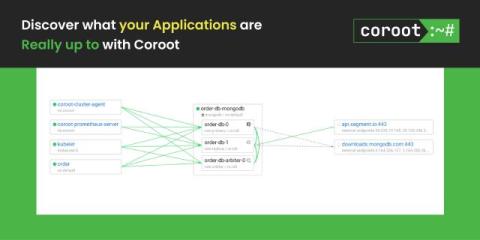
Network observability in Kubernetes clusters for better security and faster troubleshooting

For DevOps and platform teams working with containers and Kubernetes, reducing downtime and improving security posture is crucial. A clear understanding of network topology, service interactions, and workload dependencies is required in cloud-native applications. This is essential for securing and optimizing the Kubernetes deployment and minimizing response time in the event of failure.

5 Ways To Optimize Skyrocketing Observability Costs

Many of our customers frequently ask us how they can calculate the ROI of their observability platforms. It’s a tough question, and one that comes up because company decision-makers often feel like they may be overpaying for observability when things are running smoothly – especially when it comes to their applications.

Why Metrics are the Most Critical Data Type in Observability

Editor’s Note: This is the fourth and final installment of a series of blog posts previewing our State of Observability 2024 survey report. In last week’s episode of this blog series, we looked at whether observability is replacing or enhancing existing IT monitoring tools. This week, we’ll look at why metrics are the most important observability data type to ITOps teams and what's holding back tracing.

Update on Cisco and Splunk Observability, Better Together

Eight weeks. When someone asks me about the synergies of Cisco + Splunk with regards to full-stack observability, I think about how much we’ve accomplished in just eight weeks. Eight weeks since the close of the acquisition, our teams have already come together to jointly develop, and will deliver, a new capability for enabling observability across the entire digital footprint for both Cisco and Splunk customers.

My 3 Lessons About OpenTelemetry for Observability

As a fan of OpenTelemetry, I love to see Cribl meeting customers where they are and helping them get to where they want to be with a vendor-agnostic approach. Where it is not possible or practical to re-instrument a telemetry source, whether an application or infrastructure, the barrier to adopting OpenTelemetry Signals can be daunting.

Independent, Involved, Informed, and Informative: The Characteristics of a CoPE

As our Field CTO Liz Fong-Jones says, production excellence is important for cloud-native software organizations because it ensures a safe, reliable, and sustainable system for an organization’s customers and employees. A CoPE helps organizations cultivate the practices and tools necessary to achieve that consistently. In part one of our CoPE series, we analogized the CoPE with safety departments.

Unlock The Power of Dynamic Instrumentation for Enhanced Software Observability

In software development, dynamic instrumentation is a powerful linchpin between the development and debugging workflows. With software complexity reaching unprecedented levels, it is also a key enabler in boosting developer productivity in the pursuit of building performant and error-free software. Let’s explore the concept of dynamic instrumentation and understand how it boosts software development processes with unparalleled insights into the source code.

Virtualizing Our Storage Engine

Our storage engine, affectionately known as Retriever, has served us faithfully since the earliest days of Honeycomb. It’s a tool that writes data to disk and reads it back in a way that’s optimized for the time series-based queries our UI and API makes. Its architecture has remained mostly stable through some major shifts in the surrounding system it supports, notably including our 2021 implementation of a new data model for environments and services.