Operations | Monitoring | ITSM | DevOps | Cloud

Latest News

Grafana Provisioned Alerting for Effective Observability

Implementing a consistent and reliable alerting system across a sprawling organization is a significant challenge for just about any engineering team. For example, diverse infrastructures across different teams and numerous team-specific customizations may not translate well when investigating specific incidents. Inconsistent alerting practices can eventually lead to fatigue, leading to triggering of alerts that may not be relevant or actionable.

Why More Choices Matter With Observability Tools

Observability is a broad topic that provides visibility into the key metrics powering customer-facing applications. These applications range from external facing applications ( e.g., Internet banking/online education/e-commerce/government records ) to internal facing applications ( e.g., Trading systems by brokers, Logistics controllers, Traffic Management, and Hotel Reservations). Observability also incorporates backend systems powering industries that ensure smooth operations of tools and processes.

Application Observability And Its Role In Modern Software Development

Over the last few decades, software systems have grown complex due to the emergence of cloud-native architectures and multi-cloud environments. On the one hand, this makes it difficult to detect issues faster in the deployed application. It also requires intricate coordination between development, DevOps, and SRE teams, as they are also expected to speed up the whole software delivery process.

Devops Best Practices for Observability

Imagine one night you receive a notification from your team member that a critical production problem has caused chaos in your application. There is a sudden drop in sales as customers are unable to access the application and reporting issues relating to the same. Now, when you reach the office to fix the issue, you demand the team to run through all the files.

How to achieve Observability for Microservices-based apps using Distributed Tracing?

Modern digital organizations have rapidly adopted microservices-based architecture for their applications. Microservices-based apps have components designed around business capabilities serving a specific purpose. It enables smaller engineering teams to own specific services that lead to increased productivity. But componentization also leads to complexity. Today’s modern internet-scale businesses have hundreds or thousands of microservices.

Elastic Observability 8.14: New feature for SLO, AI Assistant, and .NET for Universal Profiling

Elastic Observability 8.14 announces the general availability (GA) of key Service Level Objective (SLO) management capabilities, additional enhancements to the Elastic AI Assistant for Observability, alerting improvements, and Universal Profiling for.NET. Enhanced SLO management capabilities: Enhanced AI Assistant capabilities.

Cisco builds a unified observability experience between AppDynamics and Splunk

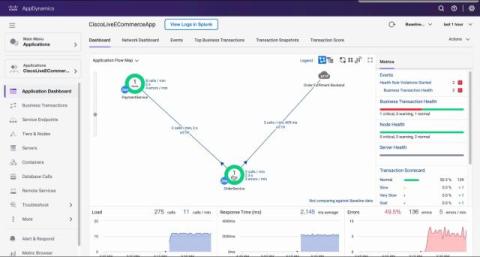
Our unified observability initiative enables a seamless experience across AppDynamics and Splunk. The first unified observability integrations include SSO and contextual deep linking, allowing users to quickly and intuitively navigate between AppDynamics and Splunk throughout the hybrid troubleshooting workflow. This dramatically improves operational productivity, accelerates mean time to detect (MTTD), and reduces time to remediation (MTTR).

Native and eBPF-based Kubernetes Workload Profiling for Kubernetes Clusters

System observability is an essential part of identifying performance issues within your environment because it provides a comprehensive view of how your systems are operating at a glance. Typically, observability is achieved through the collection and analysis of metrics. These metrics, generated by your applications, are deliberately incorporated by developers into the source code to offer insights into the application’s internal processes.

Bringing ArchiMate Flow Diagrams to Life with End-to-End Observability

Aligning IT infrastructure with business processes is paramount in today's digital landscape. This article explores how organizations can elevate their architectural modeling by integrating ArchiMate's flow diagrams, which are initially manually created, with the dynamic, auto-discovered components from StackState's end-to-end observability.