Operations | Monitoring | ITSM | DevOps | Cloud

Latest News

And the Killer App for Observability is...Integrations

Editor’s Note: This is the third installment of a series of blog posts previewing our State of Observability 2024 survey report. So far in this blog series, we’ve looked at where enterprises and MSPs are in their observability journeys and the benefits and challenges of their observability deployments. This week, we look at whether the observability story so far is more about replacing or enhancing existing IT management tools.

It is the time to simplify Observability!

I come from the database world where observability, or monitoring as we used to call it, was always really important to keep databases up and running and operating well. Thousands of data points would be collected and displayed in countless graphs. As an expert DBA, you can see every detail about internal database operations and feel very good about yourself being able to put all this data together and resolve the puzzle.

Coroot v1.0: Unified Observability for Heterogeneous Infrastructures

In the current cloud-native era, almost every organization has one or more Kubernetes clusters in their production infrastructures. However, only a small percentage of companies, especially enterprise-level ones, can claim that they are fully committed to running everything exclusively on Kubernetes. The most typical scenario is that new stateless services are deployed on Kubernetes, while legacy applications, third-party services, and databases continue to run on dedicated VMs or bare-metal nodes.

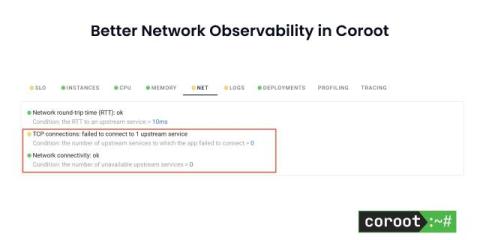
Better Network observability in Coroot

One service can’t connect to another (or can’t establish a database connection) – underneath this simple definition, there can be two very different conditions. First – we may have a service process down. In this case, the Kernel stack is operational, so we are getting the packet back, indicating the connection was refused. Second – when network flow is completely disrupted due to connectivity issues, firewall, or a node being completely down.

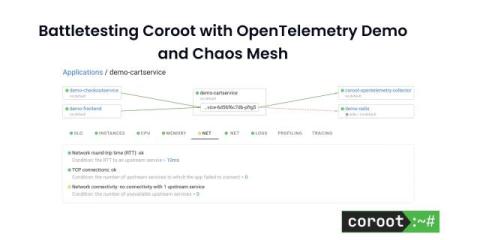
Battletesting Coroot with OpenTelemetry Demo and Chaos Mesh

The most effective method for evaluating an observability tool is to introduce a failure intentionally into a fairly complex system, and then observe how quickly the tool detects the root cause. We’ve built Coroot based on the belief that having high-quality telemetry data enables us to automatically pinpoint the root causes for over 80% of outages with precision. But you don’t have to take our word for it—put it to the test yourself!

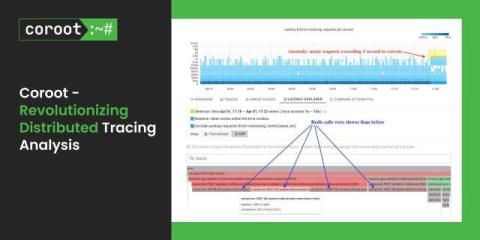
Coroot v1.0: Revolutionizing Distributed Tracing Analysis

We’re excited to announce Coroot v1.0 – our first stable version. It includes some great improvements, such as a new Distributed Tracing interface that takes troubleshooting to the next level. In this post, we’ll compare existing open-source distributed tracing tools, identify unsolved problems in the troubleshooting process, and see how Coroot can address them with its brand-new distributed tracing feature. These days, software is getting more complicated.

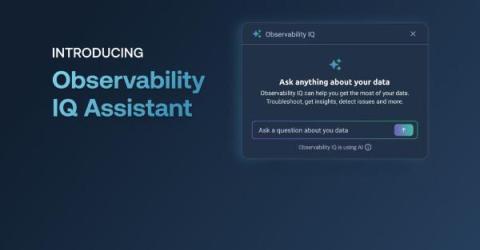
Logz.io Observability IQ Assistant: Practical AI that Helps You Work Smarter

AI has been the biggest macro-trend in technology for some time now, and the observability space is no exception to this rule. Just look at the findings of the 2024 Observability Pulse Report; it’s evident that organizations are hungry for AI capabilities that help address pervasive issues of observability process maturity, the talent shortage, ever-increasing MTTR, and the skyrocketing cost of observability.

For Fourth Straight Year, GigaOm Names Broadcom Leader in Network Observability

For the fourth consecutive year, Broadcom has been named the highest-scoring leader and outperformer in the 2024 GigaOm Radar Report for Network Observability. In this latest report, GigaOm defines network observability as “a category of solutions that go beyond device-centric network monitoring to provide truly relevant end-to-end visibility and intelligence for all the traffic in your network, whether on-premises, in the cloud, or anywhere else.”

Monitoring vCenter with AIOps and Observability from Broadcom

DX Application Performance Monitoring (DX APM) provides powerful capabilities for monitoring the health and performance of your vCenter infrastructure. In addition to capturing and analyzing important monitoring data, the solution will correlate vCenter performance metrics with metrics of other applications monitored by DX APM.