Operations | Monitoring | ITSM | DevOps | Cloud

Latest News

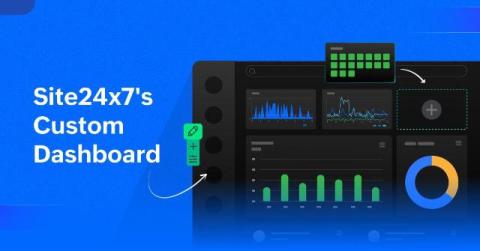
Transform your monitoring experience-Site24x7's Custom Dashboard

The dashboard in Site24x7 provides a solid foundation, but its true potential is unlocked through customization. Custom Dashboards enable you to personalize your monitoring experience, focusing on the metrics that matter most to you. By incorporating a variety of widgets, you can create a tailored and comprehensive view of your system's performance. Site24x7’s Custom Dashboards come packed with features designed to elevate your monitoring capabilities.

Status page selector: Switch between status pages

We’re excited to announce a new feature designed for our customers with multiple boards and status pages – introducing the Status Page Selector! Now, users can switch between different status pages directly from a single page. This is especially useful for companies that need separate status pages for different products, departments, or teams.

New Relic vs Sentry - Which Monitoring Tool to Choose? [2024]

Monitoring tools are essential for developers to maintain application performance and quickly resolve issues. Choosing the right one requires understanding how different tools align with your needs and budget. In this blog, I have compared two popular tools, focusing on their strengths, common features, and unique differences. By knowing these aspects, you will be better equipped to select the tool that fits your requirements.

How Device Management Companies Can Simplify Monitoring

Many companies that provide IoT or device management solutions need help building an in-house monitoring solution. Managing devices for your clients is challenging enough—building a monitoring system is not everyone's wheelhouse and takes time to set up. In this article, we will review some of the most common use cases for device management companies and discuss how these businesses can use MetricFire to save time and money on their monitoring.

Best Practices for Client-Side Logging and Error Handling in React

Logging is an essential part of development. While working on React projects, logging provides a way to get feedback and information about what’s happening within the running code. However, once an app or website is deployed into production, the default console provides no way to continue benefiting from logs.

Key Prometheus concepts every Grafana user should know

Prometheus has become an essential technology in the world of monitoring and observability. I’ve been aware of its importance for some time, but as a performance engineer, my experience with Prometheus had been limited to using it to store some metrics and visualize them in Grafana. Being a Grafanista, I felt I should dig deeper into Prometheus, knowing it had much more to offer than just being a place to throw performance test results.

RabbitMQ vs Kafka vs Redis

RabbitMQ, Apache Kafka, and Redis are some of the most popular microservices message brokers on the market. However, while they’re all the same type of tool, they each offer different features that make them better adapted for specific use cases. To further understand this, in this article, we will outline the main similarities and differences between these tools and highlight which is the best tool for various use cases.

Azure Logging Unleashed: Your Key to Cloud Performance

The Azure Cloud platform processes an extensive variety of data including Eventhub Diagnostic Logs, Kubernetes Metrics, SQL Logs, Activity Logs, Container Activity Logs, and Azure Metrics. Depending on the requirements of your organization these logs offer various levels of importance and priority. But it’s more than likely that you will be monitoring a large variety of these logs.