Operations | Monitoring | ITSM | DevOps | Cloud

Latest News

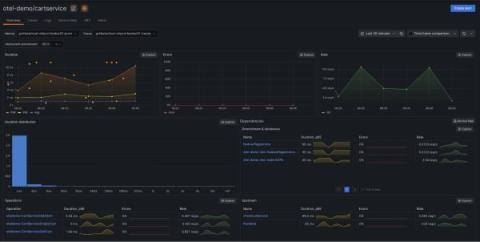
Grafana OpenTelemetry distributions: prioritizing simplicity, sticking to OSS values

The OpenTelemetry (OTel) project offers numerous components and instrumentations that support different languages and telemetry signals. However, this flexibility can be overwhelming, and new users often struggle to choose the right components and configure them properly for their specific use cases. To address this, OpenTelemetry defines the concept of a distribution, a tailored and customized version of OpenTelemetry components.

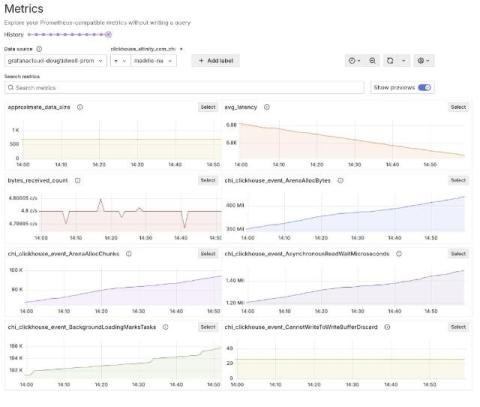
How to monitor metrics and logs from Altinity.Cloud in Grafana Cloud

Doug Tidwell is the Director of Content at Altinity, responsible for creating useful content for ClickHouse users in general and Altinity customers in particular. He has more than 30 years of experience in databases, CI/CD systems, development tools, and middleware. When it comes to visualizing, monitoring, and logging ClickHouse clusters, there’s no easier way to accomplish all three than with Grafana Cloud, the open and composable observability stack powered by open source.

Monitoring Kafka Performance: What Metrics Matter?

Running Apache Kafka in production? You know monitoring is a must. But with all those metrics coming at you, it’s easy to get lost in the weeds. After a while, you start to figure out that monitoring everything isn’t really worth it. It’s about focusing on a few key metrics that give you the biggest bang for your buck. Here’s a breakdown of the most important Kafka performance metrics to keep your eye on.

Optimize Network Asset Organization with Global Collections in DX NetOps

One thing most IT and network operations teams continue to contend with is more: more technologies, more vendors, more devices, and more complexity. Given these realities, its vital for network operations teams to minimize operational overhead wherever and whenever possible.

DX NetOps Accelerates Triage, Delivering Contextual Access to Syslog

Network operations teams face challenges in managing modern, multi-vendor networks due to the need to collect and analyze data from various sources. Teams need to work with logs, events, and metrics, and this data is often scattered across different tools and locations. This fragmentation leads to inefficiency and complexity, as operators must switch between tools and interfaces to troubleshoot issues.

How to Integrate .NET with Logit.io

If you use the programming language C# there’s a chance that you’re already familiar with.NET (pronounced ‘dot net’), an open-source application platform supported by Microsoft. C# is the programming language for.NET but the platform can run programs written in multiple languages. Microsoft’s ambition with.NET is to offer developers one platform to solve any problem.

Insights into SigNoz's Latest Features - A Conversation with Ankit, CTO of SigNoz

We sat down with Ankit, CTO and co-founder at SigNoz to get his insights on the product’s developments and what's on the horizon. He shared valuable perspectives on how SigNoz is enhancing the user experience, focusing on customer feedback, and building new features.

Introducing Alerts History and Scheduled Maintenance - Enhancing Alert Management in SigNoz

Today, we’re excited to introduce two key features that will help users with alerts in SigNoz - Alerts History and Scheduled Maintenance. These features are designed to help teams gain deeper insights into their alerts, better manage recurring issues, and streamline alert silencing during planned downtimes. Let’s dig in deeper.

McLarens achieves 24/7 availability and uptime with Applications Manager

Uptime and IT resources availability are critical metrics for maintaining efficiency, flexibility, and scalability in the financial services industry. The continuous operation of financial technology systems ensures that providers can meet customer demands, adjust to market changes, and scale operations smoothly.