Operations | Monitoring | ITSM | DevOps | Cloud
Latest News
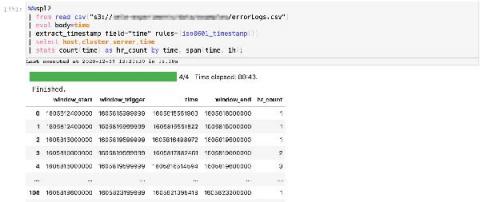
Improve DevOps Workflows Using SMLE and Streaming ML to Detect Anomalies
Modern IT & DevOps teams face increasingly complex environments — making it harder to quickly detect and resolve critical issues in real-time. To overcome this challenge, Splunk users can take advantage of ML-powered IT monitoring and DevOps solutions available in a scalable platform with state-of-the-art data analytics and AI/ML capabilities. In this blog, we deploy Splunk’s built-in Streaming ML algorithms to detect anomalous patterns in error logs in real-time.
Modernizing AIX Workloads using CloudHedge
On a given month, we get 1/3rd of requests for modernizing AIX workloads, and that’s perfectly fine because though it’s not a widely used platform there are still thousands of businesses running their mission-critical apps on AIX. Modernizing AIX workloads is a challenging task, and the next question that comes to your mind is where do you start.
Wake on LAN with IP address manager: A holistic approach to remote booting
Wake on LAN(WOL) has been a go-to solution for most network admins to ensure an uninterrupted IT resource. Aiding in remote booting of wired and wireless networks, WoL helps optimize energy usage even as it ensures your network resources are readily available. Enabling you to boot your machines on demand, and switch them to a low power mode when not in use, WoL saves you hefty power bills and helps you avoid the time-consuming manual task of restarting your network devices physically.
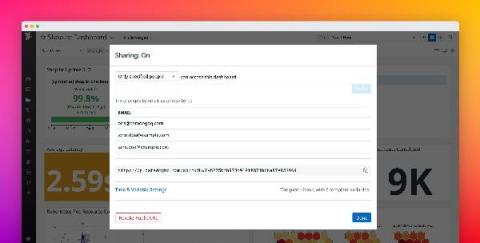
Share Datadog dashboards securely with anyone outside of your organization
Datadog dashboards provide a unified view of your application, infrastructure, and business data, giving stakeholders the context they need to make decisions. Sharing dashboards publicly is useful when you want to make them easily accessible to a large audience. But oftentimes, your dashboards include sensitive information, which is why you need finer-grained controls over the data you share—and who you share it with.
Send SMS alerts with webhooks and Twilio
When an alert triggers in your application or environment, you want your team to know as soon as possible so you can troubleshoot quickly and minimize any user-facing issues. Datadog can automatically alert you via email and collaboration services like Slack and PagerDuty. The simple, real-time communication provided by SMS can also be an effective way to alert your team.
Podcast: Break Things on Purpose | Ep. 11: Ryan Kitchens, Senior Site Reliability Engineer at Netflix
Get started with Gremlin's Chaos Engineering tools to safely, securely, and simply inject failure into your systems to find weaknesses before they cause customer-facing issues. We’re excited to kick off Season 2 of Break Things on Purpose next month. In anticipation of our next season, here’s a bonus show from our archives! Subscribe to Break Things on Purpose wherever you get your podcasts. Find us on Twitter at @BTOPpod or shoot us a note at podcast@gremlin.com!
Using Helm to Deploy a Kubernetes Application to Multiple Environments (QA/Stage/Prod)
One of the most typical challenges when deploying a complex application is the handling of different deployment environments during the software lifecycle. The most typical setup is the trilogy of QA/Staging/Production environments. An application developer needs an easy way to deploy to the different environments and also to understand what version is deployed where. Specifically for Kubernetes deployments, the Helm package manager is a great solution for handling environment configuration.
Generate Code Coverage Reports using Coveralls and Codefresh
Coveralls is a web service that allows users to track the code coverage of their application over time in order to optimize the effectiveness of their unit tests. Once you are managing your application and associated resources within a CI/CD platform like Codefresh, you want to receive insights on the test coverage automatically with every pipeline build. This post provides an overview of how this can be achieved with Coveralls and Codefresh.


