Operations | Monitoring | ITSM | DevOps | Cloud

Latest News

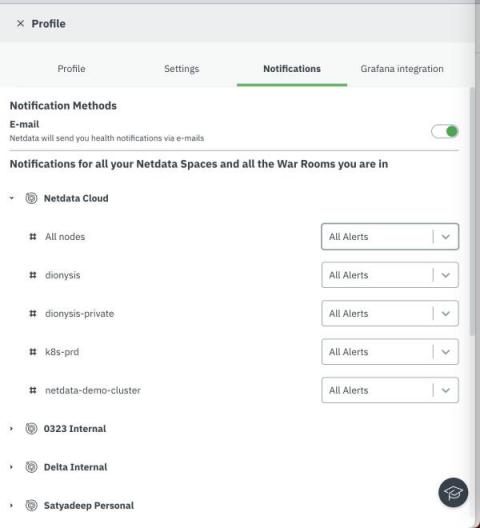
How to mute alerts during maintenance windows or scheduled backups?

The health management APIs in Netdata allows teams to eliminate unnecessary alerting during scheduled maintenance, testing, auto scaling events, and instance reboots. For all SREs, it is absolutely crucial to filter out expected events during maintenance windows and quickly pinpoint critical issues in your infrastructure. Every minute is crucial while dealing with troubleshooting issues and any distractions that may hijack the troubleshooting process should be subdued.

The Top 10 Products From KubeCon North America 2022

The KubeCon event is a major cloud-native gathering thousands of people and hundreds of vendors for 3 days. Technology enthusiasts and adopters from leading cloud-native and open-source communities gather and discuss innovative ideas at KubeCon. It provides a forum where you can exchange relevant information and insights on the latest trends in Kubernetes and the container world.

Getting started with severity levels

An incident can take many forms. It can look like a small issue that locks a few customers out of their accounts or a huge catastrophe that brings down your entire product for a full day. How you respond to the incident should vary based on the impact of the incident. And that’s where severity comes into play. Defined severity levels are crucial to any good incident management program.

Pandora's Flask: Monitoring a Python web app with Prometheus

We eat lots of our own dog food at MetricFire, monitoring our services with a dedicated cluster running the same software. This has worked out really well for us over the years: as our own customer, we quickly spot issues in our various ingestion, storage, and rendering services. It also drives the service status transparency our customers love. Our customers include large multinational coffee brewers, game companies, and other data science/SaaS companies.

Top 8 Open Source Dashboards

Before exploring open-source dashboard tools, we first need to learn about Dashboards and how they can be useful. A dashboard is a data visualization and management tool that visually tracks and analyzes the Key Performance Indicators (KPIs), business analytics metrics, infrastructure health and status, and data points for an organization, team, or process. It can be used to present operational and analytical business data with interactive data visualizations to your team.

State of Data on Kubernetes 2022 Survey Shows Big Payoffs for Kubernetes

Data is a modern company’s greatest asset, if used effectively. After all, in our always-connected economy, the most valuable business applications are data-driven. Customers expect real-time interactions powered by millions of end-points and massive amounts of data. To remain competitive in the market, organizations are adopting fast data applications to create new business models and transform industries, and Kubernetes is increasing the velocity with which they can be deployed.

6 Examples Of FinOps KPIs That Will Improve Your Margins

Setting FinOps KPIs helps keep your whole organization aligned toward the same financial goals. However, it takes more than simply setting a broad, company-wide financial goal and turning every employee loose to work on that goal without more specific directions. It’s far better to come up with realistic and achievable goals tailored toward each person or team that will be responsible for them. That’s because KPIs should ideally be focused around the typical persona of each team.

Low-Code/No-Code: The Past & Future King of Application Development

Business organizations that want to save money and be competitive take into consideration the time costs associated with investments in new technologies. Will the efficiency gains translate to a rapid return on investment? Will users embrace the change and be more productive? Or will those investments be a hassle to employees and result in time-wasting workarounds and a fallback to inefficient, manual processes?