Operations | Monitoring | ITSM | DevOps | Cloud

Measuring Pricing Effectiveness: The Process (Part 2 of 2)

Deciding what metrics to measure leads to the next big issue: How to Measure. Often the problem is not so much in the measuring but in the comparison. Measuring the revenue is only useful if you can compare it to a baseline of revenue to know whether the result is good or not. Summarized, there are four basic techniques, each with advantages and disadvantages: Test and Control: Typically execute new pricing in some locations while using the legacy process in others.
The Simple Guide To The History Of The Cloud

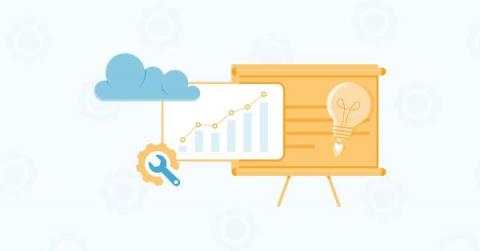
The first person to coin the term “Artificial Intelligence” predicted that someday people would buy software as a utility. The year was 1961 and that person was Professor John McCarthy, a computer scientist at Stanford University. After Salesforce began selling software programs this way in the late-1990s, the good professor witnessed his prophecy come true for over 12 years before his passing in 2011. Yet this is only one aspect of computing in the cloud as we know it today.

Announcing LM Exporter

We recently introduced the LogicMonitor Exporter which is now a part of OpenTelelemetry Collector Contrib distro. This allows you to bring your collector for streaming telemetry data from your environment to LM Envision, LogicMonitor’s hybrid and multi-cloud monitoring platform. LogicMonitor associates the exported logs and traces from a single OpenTelemetry collector to simplify your application’s operations and troubleshoot issues.

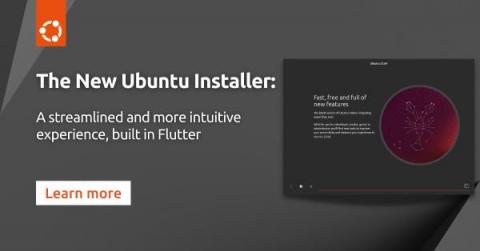
How we designed the new Ubuntu Desktop installer

Back in 2021, Ubuntu Desktop engineering manager Ken VanDine talked about Canonical’s investment in Flutter support for Linux. To demonstrate the versatility of the Flutter toolkit, we committed to redesigning the Ubuntu installer experience as part of a larger overhaul of the underlying technology behind the Ubuntu installer. Up until now, the Ubuntu Server and Desktop installers had two separate underlying code-bases.

8 Data Center Energy Consumption Trends You Need To Know

Did you know that the data center industry accounts for 3% of global electricity consumption and is expected to hit 4% by 2030? Due to rising energy costs and increased public pressure around the environmental impact of data centers, many of today’s organizations have launched corporate sustainability initiatives and data center professionals are cracking down on energy usage to support those goals.

State of Preview Environments Report 2023

The State of Preview Environments Report is a survey conducted by Qovery gathering feedback from 1,289 seasoned software engineers with diverse experiences, ranging from growing to enterprise-level organizations. This report aims to get a pulse on the perception and adoption of Preview Environments among the software engineering community.

8 Best IT Monitoring Tools and Software of 2023 (Updated)

Monitoring tools, also known as observability solutions, are designed to track the status of critical IT applications, networks, infrastructures, websites and more. The best IT monitoring tools quickly detect problems in resources and alert the right respondents to resolve critical issues. Response teams use observability solutions to gain real-time insights into resource availability, stability and performance.

Revolutionize Your Cloud-Native Deployments with CloudFabrix using Kubernetes and OpenTelemetry

The Cloud Native Computing Foundation (CNCF) is a non-profit organization dedicated to advancing the adoption of cloud-native technologies and practices. Established in 2015 as a part of the Linux Foundation, the CNCF has become a prominent open-source organization that aims to develop a standardized and vendor-neutral cloud-native stack. The CNCF seeks to enable the use of cloud-native computing for building scalable and resilient applications in dynamic environments.

Install Prometheus on Kubernetes: Tutorial & Examples

As one of the most popular open-source Kubernetes monitoring solutions, Prometheus leverages a multidimensional data model of time-stamped metric data and labels. The platform uses a pull-based architecture to collect metrics from various targets. It stores the metrics in a time-series database and provides the powerful PromQL query language for efficient analysis and data visualization.