Operations | Monitoring | ITSM | DevOps | Cloud

Increasing Implications: Adding Security Analysis to Kubernetes 360 Platform

A quick look at headlines emanating from this year’s sold out KubeCon + CloudNativeCon Europe underlines the fact that Kubernetes security has risen to the fore among practitioners and vendors alike. As is typically the case with our favorite technologies, we’ve reached that point where people are determined to ensure security measures aren’t “tacked on after the fact” as related to the wildly-popular container orchestration system.


Elastic Common Schema and OpenTelemetry - A path to better observability and security with no vendor lock-in

At KubeCon Europe, it was announced that Elastic Common Schema (ECS) has been accepted by OpenTelemetry (OTel) as a contribution to the project. The goal is to achieve convergence of ECS and OpenTelemetry’s Semantic Conventions (SemConv) into a single open schema that is maintained by OpenTelemetry. This FAQ details Elastic’s contribution of Elastic Common Schema to OpenTelemetry, how it will help drive the industry to a common schema, and its impact on observability and security.

Lightstep from ServiceNow deepens commitment to OpenTelemetry project

At Lightstep, we’ve seen many organizations grapple with “cloud-native sticker shock” as they come to understand that these complex systems require sifting through massive amounts of data across architectures and proprietary solutions. In today’s macroeconomic environment, organizations are looking to reduce costs while driving innovation, especially when it comes to cloud-native applications.

IT Incidents vs. Alerts

IT incidents are events which lead to a disruption or deviation from the regular operating standards of a computer system or network. They can be caused by various factors, including hardware or software failures, human error, or even deliberate external (cybersecurity) attacks. It begins with short delays, or services cutting out - for example, when a website or server is down, or access to data(bases) takes too long.

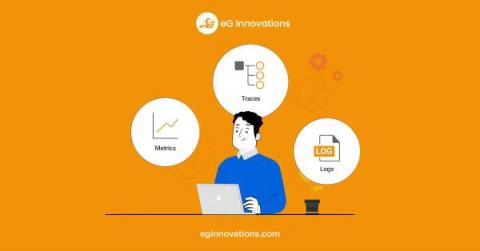
The Three Pillars of Observability: Metrics, Logs and Traces

Metrics, Logs and Traces are often referred to as The Three Pillars of “Observability“. The term observability has been used in control theory to refer to how the state of a system can be inferred from the system’s external outputs. Applied to IT, observability is how the current state of an application can be assessed based on the data it generates. Applications and the IT components they use provide outputs in the form of metrics, events, logs and traces (MELT).

Optimize your CI/CD Pipeline with Coralogix Tagging

Continuous Integration/Continuous Delivery (CI/CD) has now become the de-facto standard for all engineering teams seeking to keep pace with the demands of the modern economy. At Coralogix, we operate some of the most advanced build and deploy pipelines in the world. We’ve baked that knowledge into our platform with a CI/CD Observability feature called Coralogix Tagging.

Rest Assured, Cribl's Improved Webhook Can Now Write to Microsoft Sentinel

As version 4.0.4, we are excited to announce the capability of Cribl’s webhook to write to any destinations and APIs that requires OAuth including Microsoft Sentinel. Cribl has long supported OAuth in many destinations through native integrations but with the enhanced Webhook we can now write to any destination that require OAuth authentication.

A Guide to OpenTelemetry for .NET Engineers

Hey.NET engineers! Today, we’ll explore the world of OpenTelemetry, focusing on how it can benefit your.NET applications. We’ll talk about the strengths and weaknesses of OpenTelemetry, walk you through the setup process, discuss the basics, and share some best practices. Plus, we’ll touch on topics like auto-instrumentation, metrics, and more. So, let’s dive in!