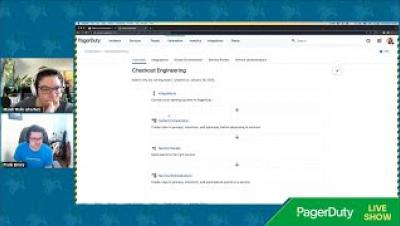
Operations | Monitoring | ITSM | DevOps | Cloud

IT Workflow Explanation

IT Workflow Automation serves to automates the execution of IT tasks and processes. This can include everything from provisioning new servers and deploying software updates to monitoring and troubleshooting IT systems. Workflow automation helps organizations reduce the time and effort required to perform these tasks by automating manual processes and eliminating the need for manual intervention. It can also improve the accuracy and consistency of these processes, as there is less room for human error.

10 Points of consideration for investing in an Observability Platform for your organization.

10 Points of consideration for investing in an Observability Platform for your organization: Scalability Can the observability platform handle the volume of data that your organization generates? Compatibility Is the observability platform compatible with your organization's existing systems and technologies? Ease of use Is the observability platform user-friendly and easy for your team to adopt and use?

That's Great IT: Build and defend your 2023 ITOps budget

It’s that time of year when ITOps leaders quantify their plans in budgets that must compete with other equally hungry groups for limited corporate resources. How can the thankless task of proactively preventing outages and speeding time to resolution win against funding flashier projects? Real-world facts can make that difference. Some of the major topics Nigel and Craig will discuss is how to help organizations successfully build and defend their 2023 ITOps budget for investments in tooling, headcount, and workflow improvements.

Dashboard Fridays: Sample Azure Monitor Dashboard

These Azure dashboards built in SquaredUp show some of the capabilities of SquaredUp’s Azure plugin. SquaredUp lets you easily create dashboards for your Azure resources, scoping a new tile with just a few clicks. The Azure plugin provides the ability to show metrics, alerts, and cost, as well leverage KQL queries against Application AppInsights and Log Analytics workspaces - all from one plugin. When scoping a tile, you can also choose whether to group, aggregate, sort or filter the data.

Dashboard Fridays: Sample Kubernetes dashboard

Engineers need to understand the status of microservices run on EKS, like health status of clusters and nodes, to avoid issues impacting business critical microservices. Plus, you need to be able to keep an eye on EKS resources, including whether the Kubernetes cluster has auto-scaled (where enabled). Usually, to view these metrics, it requires looking at each EKS cluster and node group individually in the AWS Console, or via another complex third-party dashboarding tool. The data is siloed and difficult to consolidate.

Real-time insights with Aiven for Apache Flink | Aiven webinar

Operating real-time streaming analytic solutions at scale can be difficult. In this session, Senior Solutions Architect Morvarid Aprin will describe some of the common challenges encountered in this arena, and how Aiven for Apache Flink is an excellent choice in overcoming these to provide businesses with valuable real-time insights. And then, she will show us just how easy it is to spin up Aiven for Apache Flink in our intuitive Console, and take a look at some use cases.