Operations | Monitoring | ITSM | DevOps | Cloud

Latest Videos

Resource Management, Images, and more with ServiceDesk Plus 11.1

The user education team at ServiceDesk Plus brings you a close-up on all the great features built into ServiceDesk Plus 11.1. Learn how resource management helps you distribute tasks among your techs; add images to your service templates; customize your application pages by user, and much more.

How to Quickly Identify Suspicious Network Behavior With Intuitive Dashboards in SolarWinds SEM

Log and event data are a boundless and valuable resource for identifying suspicious network activity and stopping potential breaches. However, analyzing lines and lines of text-based data can make this resource more trouble than it's worth. In this video, we'll explore the different ways you can customize log data in an easy-to-understand and visual dashboard in Security Event Manager to help turn it into something you can act on.

SolarWinds Server Configuration Monitor Overview

SolarWinds Server Configuration Monitor (SCM) is designed to provide insights into Windows® server and application changes to help you pinpoint the root cause of performance problems faster. Detect, track, and receive alerts when changes occur, allowing you to correlate system performance against configuration changes, know who made changes, and compare configurations over time. SCM integrates with SolarWinds Server & Application Monitor, allowing you to extend troubleshooting of system and application performance from one unified console.

Virtualized Database Performance Tuning

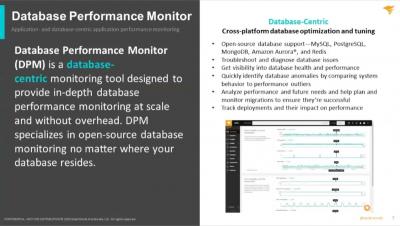
Virtualized database instances are becoming more and more common, but many DBAs try to avoid virtualized databases because of the added complexity they can bring to performance resolution. With the VMware option, SolarWinds Database Performance Analyzer (DPA) provides detailed information related to whether the culprit affecting database performance is located in the virtualization layer or inside the database itself.