Operations | Monitoring | ITSM | DevOps | Cloud
The latest News and Information on Log Management, Log Analytics and related technologies.
Know Your Customer Again Revisited
Unlocking seamless API management: Introducing AWS API Gateway integration with Elastic
AWS API Gateway is a powerful service that redefines API management. It serves as a gateway for creating, deploying, and managing APIs, enabling businesses to establish seamless connections between different applications and services. With features like authentication, authorization, and traffic control, API Gateway ensures the security and reliability of API interactions.
Apache Logs - Turning Data into Insights!
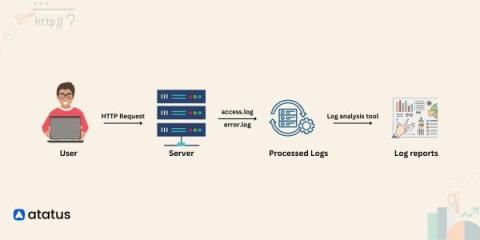
In the vast digital landscape of the internet, where websites and web applications serve countless users daily, there exists a silent but powerful guardian of information – Apache logs. Imagine Apache logs as the diary of your web server, diligently recording every visitor, every request, and every response. At its core, Apache logs capture a variety of critical information. They record the IP addresses of visitors, revealing their geographic locations and potentially malicious activities.
Loki Log Context Query Editor in Grafana 10
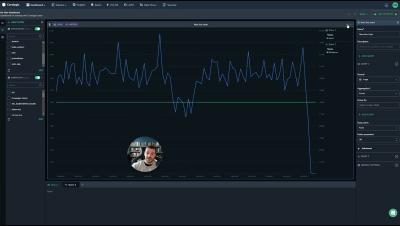
Coralogix Deep Dive - Custom Dashboards
Why You Need An Application Performance Monitoring Tool
As organisations strive to deliver seamless user experiences, maximise operational efficiency, and maintain a competitive edge, the need for comprehensive Application Performance Monitoring (APM) tools becomes increasingly evident. APM tools offer invaluable insights into the performance and behaviour of applications in real-time. They go further than the conventional monitoring approach by providing a holistic view of the entire stack, encompassing servers, databases and user interactions.
5 AWS Logging Tips and Best Practices
Terraform is No Longer Open Source. Is OpenTofu (ex OpenTF) the Successor?
Terraform, a powerful Infrastructure as Code (IAC) tool, has long been the backbone of choice for DevOps professionals and developers seeking to manage their cloud infrastructure efficiently. However, recent shifts in its licensing have sent ripples of concern throughout the tech community. HashiCorp, the company behind Terraform, made a pivotal decision last month to move away from its longstanding open-source licensing, opting instead for the Business Source License (BSL) 1.1.


