Operations | Monitoring | ITSM | DevOps | Cloud
The latest News and Information on Log Management, Log Analytics and related technologies.
Best Practises For Application Performance Monitoring
Application performance monitoring (APM) tools have become a fundamental part of many organisations that wish to track and observe the optimal functioning of their web-based applications. These tools serve to greatly simplify the process through automation and allow teams to effectively collaborate to maximize efficiency, enabling you to reach the root cause of an issue before it reaches your customers.
Setting the Standard for Essential Observability: Logz.io Earns 20+ Fall G2 Badges
Logz.io is thrilled to have earned over 20 Fall 2023 G2 Badges for our Logz.io Open 360™ essential observability platform! G2 Research is a tech marketplace where people can discover, review, and manage the software they need to reach their potential. We’ve earned the following Fall 2023 G2 Badges for Application Performance Monitoring (APM) and Log Analysis.
Revolutionize Data Ingestion: Introducing Terraform Support for Splunk Cloud Platform
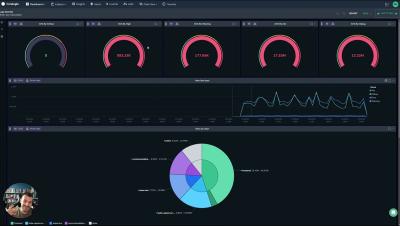
Infinite Visibility in the Coralogix Custom Dashboard Solution
LAMA: Log analytics and monitoring application
The Securities and Exchange Board of India (SEBI) recently introduced a groundbreaking API-based logging and monitoring mechanism (LAMA) framework to address the increasing concerns surrounding technical glitches in stockbrokers’ digital trading systems.
Node.js Logging Tutorial
Node.js logging is an important part of supporting the complete application life cycle. From creation to debugging to planning new features, logs support us all the way. By analyzing the data in the logs, we can glean insights, resolve bugs much quicker, and detect problems early and as they happen. In this post, we will talk about the who, what, when, where, how, and why of Node.js logging. Later in this post, the “how” section will give insights into using code.
Top 10 Mistakes People Make When Building Observability Dashboards
Observability dashboards are powerful tools that enable teams to visualize and monitor the performance, health, and behavior of their applications and infrastructure. However, building observability dashboards is not a straightforward task, and many organizations make common mistakes hindering their ability to gain meaningful insights and respond to issues effectively.
The power of effective log management in software development and operations
The rapid software development process that exists today requires an expanding and complex infrastructure and application components, and the job of operations and development teams is ever growing and multifaceted. Observability, which helps manage and analyze telemetry data, is the key to ensuring the performance and reliability of your applications and infrastructure.


