Operations | Monitoring | ITSM | DevOps | Cloud

Monitoring

The latest News and Information on Monitoring for Websites, Applications, APIs, Infrastructure, and other technologies.

Sponsored Post

Service Watch Browser Monitoring in Minutes!

You surf the internet, don't you? While all of us are at home due to Covid lock-down and accepting a new reality, the majority of the work is happening online. IT managers are looking for tools that can track the user digital experience. Executives are reading a report from Gartner or Forrester about some of the best networking monitoring solutions available on the market. Project managers are using Microsoft Teams online to communicate and ensure team members are meeting deliverables on time. Remote employees everywhere use OWA to check their office mails. No matter what, you can be quite sure that everyone is using their favorite browser and search engine for connecting online and accomplish tasks.

Multi-cloud monitoring: A quick recap

The year 2020 was a tough one and tested the grit and resilience of the human race. Organizations across the globe had to prioritize the safety of employees, customers, and associates. The rapid response to COVID-19 has enabled millions to work remotely because of advanced cloud computing technologies supplied through public cloud services like Amazon Web Services (AWS) and Microsoft Azure.

System Traceability: What is It and How Can You Implement It?

System traceability is one of the three pillars of observability stack. The basic concept of observability is of operations, which include logging, tracing, and displaying metrics. Tracing is intuitively useful. Identify specific points in an application, proxy, framework, library, runtime, middleware, and anything else in the path of a request that represents the following of either ‘forks’ in execution flow and/or a hop or a fan out across network or process boundaries.

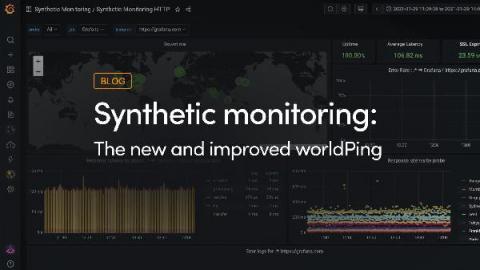
Farewell, worldPing. Hello, Grafana Cloud synthetic monitoring!

Many of us get sentimental about past projects we’ve worked on…for me it is a mobile dashboard that leveraged ML/AI to help a sales team make quicker decisions while in the field (nerdy, I know…but it was one of my first projects as a UX Designer when I was starting out my career, and I have many fond memories about this project). For many members of the team at Grafana Labs, that sentimental project is worldPing.

Monitoring Microsoft 365 User Experience using Microsoft Graph

Microsoft Graph has evolved to the API for Microsoft 365. Developers can’t get around it anymore. At NiCE, we have put the Graph API to work and want to share some of the learnings and highlights. Our core use case evolves around synthetic monitoring for M365 services like Teams, SharePoint Online, OneDrive, Exchange, and others. In this session, you will learn about the Graph API’s architecture and value in standard monitoring scenarios.

How to export logs from Google Cloud Logging to BigQuery

Welcome to the Google Cloud Video Learning Series, where we show you how to use Google Cloud services. In this episode, we’ll show you how to export logs from Google Cloud Logging to BigQuery. Customers often export logs to BigQuery to run analytics against the metrics extracted from the logs. BigQuery can help identify unauthorized changes in configuration and inappropriate access to data, thus meeting your organization’s security and analytics requirements.