Why You Should Monitor BGP and Where to Start 031122
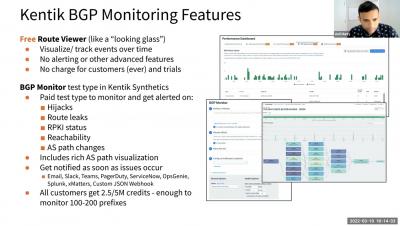
BGP isn’t just for ISPs and hosting providers anymore. As we saw with Facebook’s historic outage, it’s now a necessity for digital enterprises to proactively monitor BGP. In this webinar, Director of Product Management Anil Murty will introduce Kentik’s new proactive BGP monitoring capabilities. Join Anil to learn.