Operations | Monitoring | ITSM | DevOps | Cloud

Monitoring

The latest News and Information on Monitoring for Websites, Applications, APIs, Infrastructure, and other technologies.

Getting started with Elastic on Google Cloud

Elastic on Google Cloud gives you the power of Elastic Enterprise Search, Elastic Observability, Elastic Security as well as the Elastic Stack so you can quickly and easily search your environment for information, analyze data to observe insights, and protect your technology investments. Elastic Cloud lets you deploy your way, whether as a managed service, or with orchestration tools you manage in your Google Cloud environment.

Considerations for Product-Led Growth in Enterprise Software

Product-led growth has become a popular go-to-market strategy in the digital age. In its superlative form, everything a company does from marketing, sales, operations, development and support is driven by and through the product. The goals are to make products easier to acquire, onboard, use and achieve quick time to value. The product-led growth market strategy revolves around the user and is best geared toward engaging with smaller accounts rather than large enterprise companies.

Configuring and Troubleshooting Multicast Protocols

There are two important protocols required to get your network to forward multicast packets: IGMP and PIM. In this article, I’ll show you how to set up these protocols on your network and how to troubleshoot them. PIM (Protocol Independent Multicast) has two main versions called “dense-mode” and “sparse-mode.” There is also a “sparse-dense-mode,” which has features of both versions and is really just used to help to bootstrap a multicast network.

A Migration of 1000 Workloads Starts with a Single...

You’ve heard that old Chinese proverb that says a journey of a thousand miles begins with a single step. It’s sound advice … except if the journey you’re talking about is the one from the data center to the cloud. With cloud deployment at the center of virtually any digital transformation effort, the journey itself can have a profound impact on the successful outcomes you seek at the destination. So you have to get it right. But what does that actually mean?

Filling gaps in Kubernetes observability with the Sensu Kubernetes Events integration

Kubernetes and its various APIs offer a wealth of information for monitoring and observability. In a recent webinar with the CNCF (as well as a whitepaper based on that webinar), Sensu CEO Caleb Hailey goes in-depth into the most-useful APIs for cloud-native observability. In this post, we’ll focus on the Kubernetes Events API — including why it matters and how it can add context for your observability strategy.

Generate process metrics to analyze historical trends in resource consumption

Your application’s health depends on the performance of its underlying infrastructure. Unexpectedly heavy processes can deprive your services of the resources they need to run reliably and efficiently, and prevent other workloads from executing. If one of your applications is triggering a high CPU or RSS memory utilization alert, the issue has likely occurred before.

Getting Started with Sematext Browser SDK for Front-end Performance Monitoring

Open-sourcing a code base for the world to see after working on it for a long time is a great experience. You should care about what your users want. You want your users to have a great experience using your product. Everything has to fall into place. Performance, responsiveness, user experience, etc. all have to be exceptional. That’s why I think front-end performance metrics are crucial.

Trace discovery in Grafana Tempo using Prometheus exemplars, Loki 2.0 queries, and more

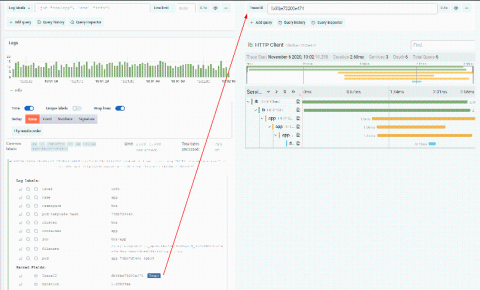
Grafana Tempo, the recently announced distributed tracing backend, relies on integrations with other data sources for trace discovery. Tempo’s job is to store massive numbers of traces, place them in object storage, and retrieve them by id. Logs and exemplars allow users to quickly and more powerfully jump directly to traces than ever before. Let’s dig into some examples with a live playground to try it out!

Tips and Tricks When Using an All-in-One Monitoring Solution

Modern IT infrastructure is a complex mixture of hardware, software, networking, and ... humans. As the data we manage continues to grow, companies rapidly expand the size of their IT environments. Managing a large-scale infrastructure and ensuring its health, performance, compliance and keeping it running smoothly is not an easy task. But with the help of an all-in-one infrastructure and virtualization monitoring solution, you can easily control everything.