Operations | Monitoring | ITSM | DevOps | Cloud


The latest News and Information on Monitoring for Websites, Applications, APIs, Infrastructure, and other technologies.

Up Your Network Monitoring Game with Auvik
The NetOps Expert - Episode 5: Broadcom Software and AppNeta - Part 2

Heartbeat check and more - is your monitoring still alive?
SIGNL4 is a cloud-based mobile alerting and incident response service. Third-party systems like monitoring tools, control systems or IoT sensors detect abnormalities and transmit events to SIGNL4 over the Internet. What if your systems cannot transmit critical events anymore? That might happen when the Internet is down or when the tool itself has a problem. In this case, SIGNL4 would miss critical events and could not turn them into alert notifications to your IT admins, technicians and experts.

TL;DR InfluxDB Tech Tips: Converting InfluxQL Queries to Flux Queries
If you’re a 1.x user of InfluxDB, you’re most likely more familiar with InfluxQL than you are with Flux. To gain a deep understanding of Flux, it’s important to understand: However, you can still use Flux without studying those topics. In this TL;DR, we’ll convert common InfluxQL queries into Flux and identify patterns between the two languages to help you get started using Flux more easily if you come from a InfluxQL or SQL background.

Digital experience and digital experience platforms, defined
Usually, people want a seamless experience when they interact with any organization. Whether a B2B or B2C interaction, the expectation is the same. In our world today, it's nearly impossible to interact with an organization without using technology. When a person interacts with an organization via a digital medium, it can be termed digital experience.

Managing Kafka on AWS with Nastel Navigator
Apache Kafka is a very popular open-source distributed event streaming platform used by thousands of companies for high-performance data pipelines, streaming analytics, data integration, and mission-critical applications. Amazon MSK is a fully managed Kafka service that makes using Kafka even easier. But how do you get started with Kafka on AWS? How do you migrate your existing Kafka environment to the cloud? How do you manage many Kafka environments at once?
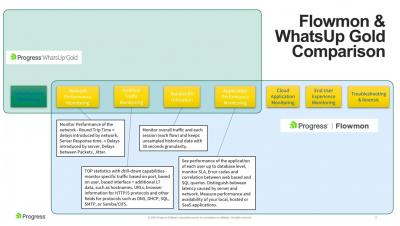
What's New and What You Can Do with WhatsUp Gold 2022

Serverless observability with OpenTelemetry and AWS Lambda
Nowadays, microservice architecture is a pattern that helps to innovate quicker by enabling easier scalability, giving language flexibility, improving fault isolation, etc. Systems built this way also bring some downsides. Moving parts, concurrent invocations, and different retries policies can make operating and troubleshooting such systems challenging. Without proper tools, correlating logs with metrics may be difficult. To overcome these challenges, you need observability.

What is a network monitoring system?
Network monitoring is a set of automatic processes that help to detect the status of each element of your network infrastructure. We are talking about routers, switches, access points, specific servers, intermediate network elements, and other related systems or applications (such as web servers, web applications, or database servers).In other words, network monitoring can be understood as taking a look at all the connected elements that are relevant to you or your organization.