Operations | Monitoring | ITSM | DevOps | Cloud
Monitoring
The latest News and Information on Monitoring for Websites, Applications, APIs, Infrastructure, and other technologies.
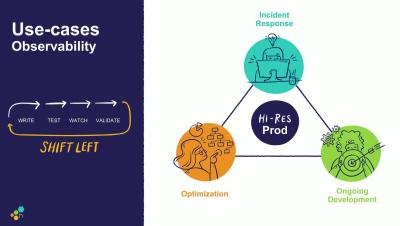
New Product Updates What Does it Mean to Observe and Debug in 'Hi Res'
Observability Maturity: Framework and Model
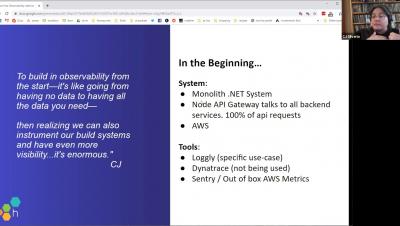
Eaze into Observability
Why Is Designing an Effective Application Logging Strategy Important?
Observability is made up of metrics, logs, and traces. These pillars help us understand the behavior of applications under normal execution, which further accelerates identifying anomalies in case of application failure or deviation from normal execution. Logging is not about tracing each and every operation, it is about sensible, consistent, and machine-readable log messages that expose the application behavior.
The 9 Most Popular PHP Frameworks for Developers
Web development before the age of web frameworks is difficult to imagine. Setting up a robust, dependable web app from scratch is a daunting task that requires years of knowledge and experience. Nowadays, however, with the help of effective, easy to use web frameworks, it doesn’t take more than a few minutes to get going.
OpsRamp Using OpsRamp for Saas Ops Excellence
Infrastructure Monitoring vs. Management: Key Differences
Infrastructure monitoring is often equated to infrastructure management, which can blur the line between two very distinct jobs. While they are different, it’s safe to say that both infrastructure monitoring and management have the same end goals, i.e., to maintain the integrity of the network, secure the server, and optimize performance. Infrastructure management (IM) has many use cases, and one of those uses cases is infrastructure monitoring.
What is Monitive?
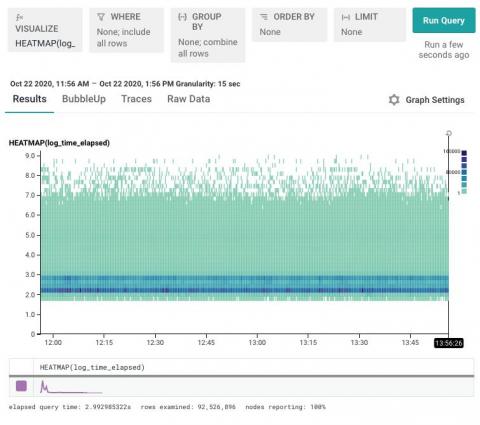
Handle Unruly Outliers with Log Scale Heatmaps
We often say that Honeycomb helps you find a needle in your haystack. But how exactly is that done? This post walks you through when and how to visualize your data with heatmaps, creating a log scale to surface data you might otherwise miss, and using BubbleUp to quickly discover the patterns behind why certain data points are different.


