Analyzing ESG Survey: Observability from Code to Cloud
Big Data Platform (BDP) Replacement Through Splunk: https://conf.splunk.com/watch/conf-online.html
## Follow Cribl


The latest News and Information on Monitoring for Websites, Applications, APIs, Infrastructure, and other technologies.
Big Data Platform (BDP) Replacement Through Splunk: https://conf.splunk.com/watch/conf-online.html
## Follow Cribl
We have always thought of our organization as special. Our plans were never to build a traditional business, and we know we have a unique culture. But it is nice when others outside of our company recognize that Grafana Labs is something special, too. This week, we were excited to be included on two very prestigious lists: The Enterprise Tech 30 and America’s Best Startup Employers.
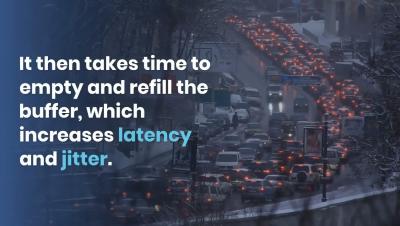
The jitter and latency are the characteristics related to the flow in the application layer. Jitter and latency are the metrics used to assess the network's performance. The major distinction between jitter and latency is that latency is defined as a delay via the network, whereas jitter is defined as a change in the amount of latency. Increases in jitter and latency have a negative impact on network performance, therefore it's critical to monitor them regularly.
While relational database management systems (RDBMS) are efficient with storing tables, columns, and primary keys in a spreadsheet architecture, they become inefficient when there’s a lot of data input received over a long period of time. Databases designed specifically to store time series data are known as time series databases (TSDB). For example, an RDBMS might look like this.
Having any form of application discovery can be of great benefit. With these capabilities, you can determine what is deployed within your infrastructure and better understand what monitoring to apply to each device. When you know which applications are running within your environment, you can group devices by their associated applications.
From a customer’s standpoint, it is always agonizing to wait for the resolution of a complaint about the product or service we have bought from a company. None of us would want to hear, “We have escalated your concern to our seniors; your patience is highly appreciated.” Let us switch to the other side of the table. Most organizations rely on a tiered approach to resolve an issue from a support perspective.