Operations | Monitoring | ITSM | DevOps | Cloud

Monitoring

The latest News and Information on Monitoring for Websites, Applications, APIs, Infrastructure, and other technologies.

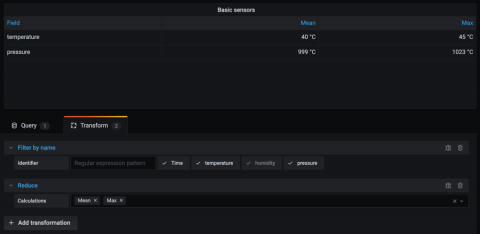
New in Grafana 7.0: Data transformations for all visualizations that support queries

Among the many new features introduced in Grafana 7.0, one of the most exciting ones is transformations. The concept of data transformation is not new to Grafana, but prior to Grafana 7, it was fairly rigid and available only in the Table panel.

IT and OT Convergence

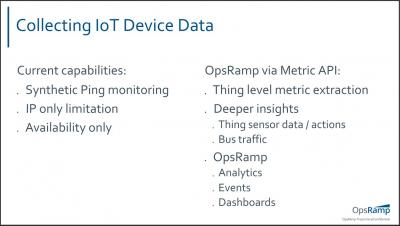
OpsRamp and Mystic River are joining forces to bring you this interactive webinar. Can we create gateways between IT and OT? IT/OT convergence has been defined as the integration of information technology (IT) systems used for data-centric computing with operational technology (OT) systems used to monitor events, processes and devices and make adjustments in enterprise and industrial operations. But what this will look like and what is the new role of IT operations management? What is changing in IT and OT to align these worlds? This Tech Talk features our partner Mystic River Consulting, a firm with proven, repeatable service delivery methodologies and a proprietary platform that drives transformational IT project results, at a game changing speed. We’ll discuss the convergence of IT and OT and dive into a demonstration to show what’s possible with OpsRamp. Also, follow us on social media channels to learn about product highlights, news, announcements, events, conferences and more -

CI/CD: What is continuous delivery?

In the first article, we talked about CI or Continuous Integration. This post looks at the second half of the CI/CD acronym, Continuous Delivery. Continuous delivery takes the build originating in the CI process and puts it into an acceptance environment for further evaluation before promoting the code to production (the released version). To back up a moment, CI is the planning, coding, testing, and building of software in a rapidly repeating process.

Introducing Sematext Synthetics for API & Website Monitoring

No matter which path of the stack you work on, it’s crucial you make sure your website or API is up and running. We wanted to create a tool that can give you superpowers. Enter, Sematext Synthetics! You can monitor the availability of APIs and websites as well as their performance, and user journeys. This means 24×7 monitoring from multiple locations around the globe with alerts when things go wrong!

DIY Tool Website Greenworks Hacked by Self-Destructing Web-Skimmer

Whilst researching recent client-side attacks our security team observed a highly-sophisticated self-cleaning and self-destructing skimmer on the popular hardware tool website Greenworks. The hack was first spotted by RapidSpike’s Client-Side Security Scanner on June 8th, and at the time of writing, the hack is still live on www.greenworkstools.com/.

New in Prometheus v2.19.0: Memory-mapping of full chunks of the head block reduces memory usage by as much as 40%

The just-released Prometheus v2.19.0 introduces the new feature of memory-mapping full chunks of the head (in-memory) block from disk, which reduces memory usage and also makes restarts faster. I will be talking about this feature in this blog post.

Best practices for database performance optimization

Proactive database performance monitoring is essential to maintain resource utilization and system performance. As data volumes grow, it is critical to monitor databases properly to deliver a seamless enduser experience, and lower IT infrastructure costs. Pinpointing database issues as they occur can assist in faster troubleshooting, and keeping the health of the application intact. Without monitoring, database outages may go unnoticed, and lead to loss of business reputation and profit.