Operations | Monitoring | ITSM | DevOps | Cloud

Monitoring

The latest News and Information on Monitoring for Websites, Applications, APIs, Infrastructure, and other technologies.

Challenges and Best Practices for Monitoring SaaS-based Businesses

SaaS-based businesses are on the rise more than ever. Old businesses are rushing to turn their legacy software into SaaS-based solutions and new businesses are popping up offering SaaS-based solutions to everything imaginable. SaaS-based solutions are made up of multi-layered complex architecture with both internal and external components that require strategic constant monitoring and optimization.

Making the Collection of Centralised S3 Logs into Splunk easy with Lambda and SQS

Got multiple AWS data sources in the same S3 bucket but struggle with efficient SNS notifications based on prefix wildcards? Well, struggle no more, we’ve got your back. Many of our customers have a centralised S3 Bucket for log collection for multiple sources and accounts. For example, all Config, CloudTrail and Access Log logs may be routed into one central bucket for an organisation.

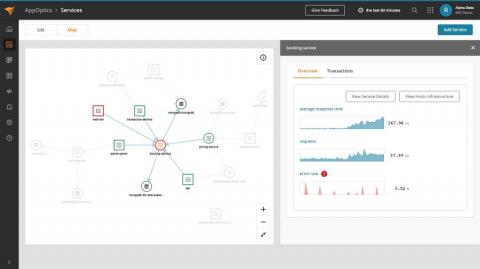
SolarWinds Updates APM Suite Designed to Simplify Application and Infrastructure Management

Introduces new service map and web transaction recorder, enhanced custom parsing rules, and search user experience to further reduce application performance management complexity and speed up troubleshooting.

How to categorize logs for more effective monitoring

Logs provide a wealth of information that is invaluable for use cases like root cause analysis and audits. However, you typically don’t need to view the granular details of every log, particularly in dynamic environments that generate large volumes of them. Instead, it’s generally more useful to perform analytics on your logs in aggregate.

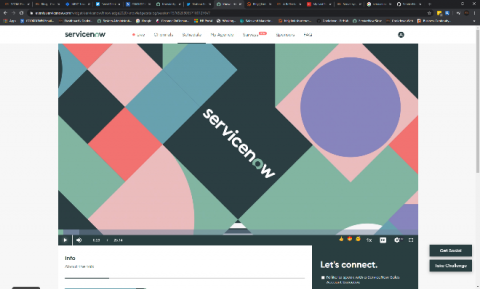
Identify, Reconcile & Rock the Multi-Source CMDB: From Nathan Foreman, Solutions Architect - Cookdown

Nathan Foreman, our solutions superstar here at Cookdown, shares his knowledge on how to successfully blend data sources to create a beautifully populated CMDB, as well as tips on how to customise and maintain data quality. Nathan talked us through the process of using ServiceNow’s out of the box Identification and Reconciliation Engine (IRE) to ensure a smooth integration of a multi-source CMDB.

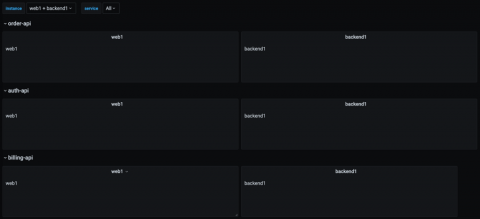
Learn Grafana: How to automatically repeat rows and panels in dynamic dashboards

Running your software on dynamic infrastructure means that your monitoring platform needs to change dynamically. Variables let you reuse a single dashboard for all your services. Select the service you want to inspect from a drop-down menu, and watch panels update to only show you metrics from that service. Grafana lets you create dynamic dashboards using template variables. Any variables in your queries interpolate the current value of the variable before the query is sent to the database.

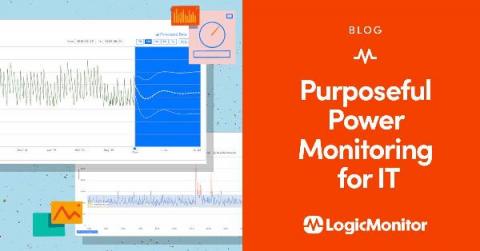
Purposeful Power Monitoring for IT

Have you ever lost power to a server? Did it ever reboot on its own? Wouldn’t it be nice to prevent power outage to IT devices? If this is something you’ve experienced in the past, there are ways to simplify power monitoring and avoid some of the outages that can be caused by power issues. This article will focus on using power consumption data from a rack power distribution unit (rPDU) and how to simplify the process.

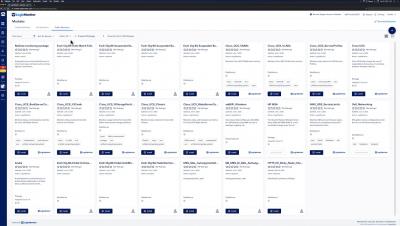
Unleash More Integrations with LM Exchange

LogicMonitor offers an ever-expanding library of integrations to bring you out-of-the-box monitoring for the networking devices, applications, databases, services, and other systems and tools your enterprise relies on. LM Exchange provides a centralized view of integrations available in LogicMonitor’s global repository—whether developed by LogicMonitor or a member of LogicMonitor’s user community.