Operations | Monitoring | ITSM | DevOps | Cloud

Monitoring

The latest News and Information on Monitoring for Websites, Applications, APIs, Infrastructure, and other technologies.

How to Identify Network or Server Resources as Root Cause to Slow Session Performance

Goliath Performance Monitor can help you isolate the root cause quickly so you can troubleshoot and resolve with permanent fix solutions. When trying to identify the root cause of a Citrix end-user experience issue, the main display where you can view all of the Citrix user sessions is the Virtual Apps & Virtual Desktops display.

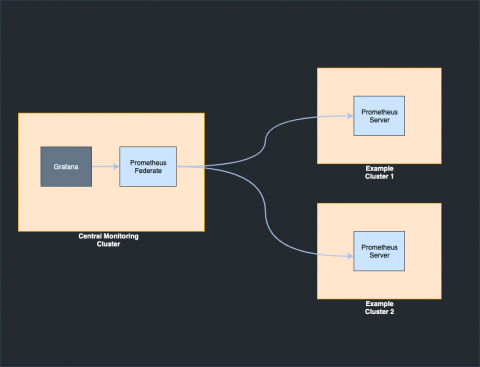
Monitoring a multi-cluster environment using Prometheus federation and Grafana

Monitoring the state of your clusters is an effective way to discover bottlenecks in your multi-cluster production environment. It is one of the key challenges that development teams are facing and factors such as the team experience as well as the number and distribution of the applications can make things even more complex. Better monitoring can help identify single points of failure.

Dear IT, Employee Engagement Is On You

Dear IT, Ten years ago you and I would have never discussed things like employee experience and engagement. We used to communicate in more defined terms. Admittedly, business needs were more centered on our customers, less on our own employees. But times have changed. This is the age of employee experience and if we don’t take it seriously, and involve IT all the way, our company we’ll get left behind.

Top 10 B2B Marketplaces a Startup Should Rely on for Fast Growth

Just as we are moving into more diverse entrepreneurial ideas, there is a massive revolution in executing the plans rightly. The advent of technology has not only brought solutions to revamp physical businesses but also introduced to avenues that are highly optimized and efficient in every sense. Many global sellers are always in the hunt of top B2B marketplace that offers a variety of features and services to help them grow faster.

Validating Change in O365

Before introducing new systems like #O365, or changes, like moving to the #Cloud, IT teams know it’s best practice to run through ‘what if’ scenarios and benchmark #performance to assess the potential impact on #userexperience. However incredibly, many still choose to skip these steps. The #consequences mean more time spent #troubleshooting, reduced service quality, poor app response time and #unhappyusers. Imagine if you could validate change quickly, but in a simple way that avoids #risk and business #disruption.

January Launch Notes: First paint preview, provider updates, and more

Raygun’s Launch Notes are your regular round-up of all the improvements we made to Raygun last month — from major features to performance updates. With the release of our new first paint and first contentful paint metrics for RUM, you’ll be able to get a more granular understanding of how users experience your application. We’ve already started the beta, and we will be releasing the feature in the next few weeks. Watch this space!

Monitor ClickHouse with Datadog

ClickHouse is an open source database management system, and was originally developed as a backend for Yandex’s Metrica analytics platform. ClickHouse is column oriented, meaning that it can quickly scan through ranges of values in a single column without touching irrelevant values in other columns. This makes ClickHouse well suited for online analytical processing (OLAP).

International Geo Information System picks NiCE Active 365 Management Pack

NiCE IT Management Solutions is proud to serve global key-players in advanced Microsoft Office 365 performance and health monitoring. Read the latest customer reference on how the NiCE Active 365 Management Pack is enabling a international geographics information system company to stay on top of Microsoft Office 365 monitoring operations.