Operations | Monitoring | ITSM | DevOps | Cloud

Monitoring

The latest News and Information on Monitoring for Websites, Applications, APIs, Infrastructure, and other technologies.

Monitor Vault metrics and logs

Hashicorp Vault is a tool for managing secrets—sensitive data such as passwords, certificates, and API keys. Vault allows you to encrypt your secrets, control access to them, and audit activity to see who has requested data from your Vault. Datadog already monitors the status of your Vault servers—for example, you can configure the Vault integration to automatically notify you if a Vault server is unexpectedly sealed, or if there is a leader change in your Vault cluster.

Sizing up the CCPA: How the USA's new privacy regulation measures up against the GDPR

The California Consumer Protection (CCPA) act took effect on January 1, 2020, and companies across the globe are scrambling to get their act together to avoid non-compliance penalties. Although enforcement of the CCPA doesn’t officially begin until July 2020, the California Attorney General’s office will still be able to penalize violations that occurred between implementation on January 1 and official enforcement in July.

New debugging superpowers with Discover

Sentry makes it pretty easy to connect a customer-facing issue right to the line of code, the release, and even the commit that caused it. At least that’s what developers tell us on Twitter. But you’re rarely working with obvious errors or errors affecting just one user. That’s why we added some new features to Discover and made diagnosing root causes even easier.

Debugging SCOM Workflows using PowerShell

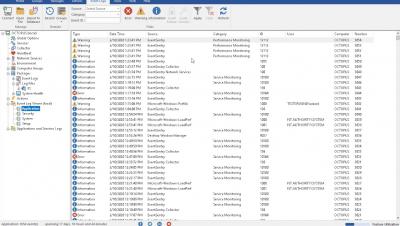
During our Management Pack Development training sessions, our senior developer Michel Kamp talked about the topic how to debug SCOM workflows using PowerShell. The Knowledge Base article listed below explains in-depth how you can debug your own workflows in SCOM using, Eventlog, WFAnalyzer, Trace by PowerShell and TraceConfig ETW Tracer. So a big thanks to Michel for sharing his knowledge and expertise.

How GripMatix created the topology overview in their SquaredUp Dashboard Pack

We're delighted to welcome Merijn Overgaauw, Service Monitoring and Automation Consultant at GripMatix, back for another guest blog. This time, he explains the creative process behind the useful topology overview of GripMatix's latest SquaredUp Dashboard Pack. Fascinating stuff!

How We're (Ab)using Hashicorp's Consul at Grafana Labs

Hashicorp’s Consul service is a distributed, highly available system that provides a service mesh solution, including service discovery, configuration, and segmentation functionality. Cortex uses Consul’s KV store to share information that’s necessary for distributing data to its components. While writing to Consul has been useful at Grafana Labs, we’ve found that as we expanded the operations, problems started arising.

DataSource Spotlight: Proactive Visibility of LDAP Security

At LogicMonitor, we believe our platform enables our customers to See More, Know More, and Do More, to keep up with the rapid pace of change in business today. The following is an interesting use case that illustrates how LogicMonitor can provide quick insight to enable modern IT teams to work proactively and perform at maximum operational efficiency.

Are Digital Transformation Initiatives Secretly to Blame for Rising Number of IT Outages?

The race is on to turn data into useful information. Company executives across a wide range of departments are increasingly tasked with modernization and digital transformation initiatives. But what is digital transformation in IT? IT pros are racing to keep up with rapid industry changes and must consider efforts such as digitizing assets, restructuring department goals to focus on providing a seamless customer experience, or shifting from on-premises to public cloud.