Operations | Monitoring | ITSM | DevOps | Cloud

Monitoring

The latest News and Information on Monitoring for Websites, Applications, APIs, Infrastructure, and other technologies.

"4:00 in the Morning" - Managing a VDI Migration

For all its benefits, Virtualization Desktop Infrastructure (VDI) continues to be a massive headache for many enterprise technology teams. From improper personas and sizing, long logon times, hangs, lost sessions, freezes and crashes—often one small mistake in a virtualized environment can set your entire enterprise ablaze.

Chaos engineering + monitoring, part 2: for starters

Oh man, did I get ahead of myself in my last post! I started chatting tools, and I realize now that I really should have been talking more about why I’m using Sensu and Gremlin. But it didn’t occur to me until last year at Monitorama. John Allspaw gave the keynote talk (Taking Human Performance Seriously). While you can watch the talk here, I’ll highlight a few points...

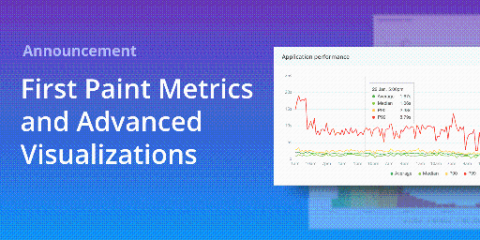
Announcing: First Paint Metrics and Advanced Visualizations

Since Real User Monitoring first launched in 2015, Raygun has helped thousands of teams identify and resolve front-end performance bottlenecks impacting their customers. Today, we’re excited to announce support for first paint and first contentful paint, along with rich new visualizations designed to help you better identify and diagnose performance problems in your software.

Azure Monitor (Part 2): Azure Monitor Logs-Getting Started

In our previous post, we discussed the question: 'What is Azure Monitor and how does it work?' and also covered the two types of data it stores, at a high level. In this part, we will get ourselves started with Azure Monitor Logs. More specifically, we'll discuss how Logs are collected by Azure Monitor or, in other words, what options you have to add data sources to Azure Monitor so you can display that data in a way that makes sense to you.

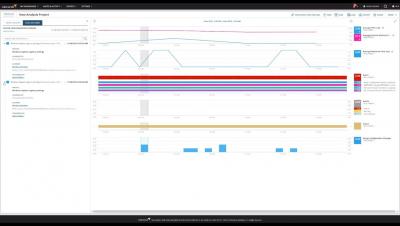
SolarWinds Server Configuration Monitor Overview

SolarWinds Server Configuration Monitor (SCM) is designed to provide insights into Windows® server and application changes to help you pinpoint the root cause of performance problems faster. Detect, track, and receive alerts when changes occur, allowing you to correlate system performance against configuration changes, know who made changes, and compare configurations over time. SCM integrates with SolarWinds Server & Application Monitor, allowing you to extend troubleshooting of system and application performance from one unified console.

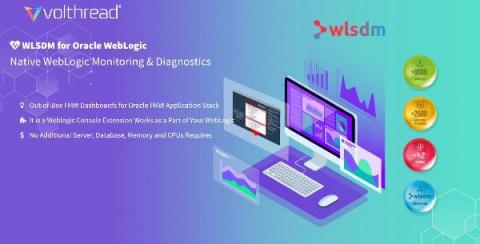
Native Oracle WebLogic & SOA Suite Monitoring

WLSDM is an enterprise “WebLogic console extension” which enables monitoring for WebLogic JMX MBean metrics and all the WebLogic domain assets (Health, Servers, Applications, Data Sources, JMS… etc.). It is very easy to create alarm and notification definitions by using WLSDM metric browser. WLSDM can store any WebLogic metric value historically and also can generate graphical reports.

Cerner Hospital Troubleshoots End-User Peripheral Issues with Goliath

A large health system with over 15 hospitals and hundreds of clinics across the U.S. provide VDI desktops to their medical staff via VMware Horizon View, and from those VDI sessions the medical staff accesses Cerner Millennium. Cerner Millennium is being delivered by Cerner’s remote hosting option (RHO) which delivers access internally via Citrix. This configuration is how 90% of their staff access Cerner Millennium.

Papertrail + Python Logging = Super Powers

Design applications to be modular. It’s a software design best practice. Modular programming is writing multiple independent programs that perform a single function but work together to achieve an overarching outcome. The benefit to this design is the smaller parts can be easily created and tested. New functionality can be slipped into the larger whole without interfering with other functions.

Citrix Monitoring in 2020

Now how many of you have better monitoring as part of your New Year’s resolution? You want to implement better monitoring into your Citrix environments, right?You want your end-users to experience less technical faults by having a system in place that allows you and the team to be more proactive. OK, probably not what you have been thinking as the clock struck midnight, but it should be part of your professional goals for 2020.