Operations | Monitoring | ITSM | DevOps | Cloud

Monitoring

The latest News and Information on Monitoring for Websites, Applications, APIs, Infrastructure, and other technologies.

Istio monitoring tools

In Part 1, we showed you the metrics that can give you visibility into your Istio service mesh and Istio’s internal components. Observability is baked into Istio’s design—Mixer extracts attributes from traffic through the mesh, and uses these to collect the mesh-based metrics we introduced in Part 1. On top of that, each Istio component exposes metrics for its own internal workings.

How to monitor Istio with Datadog

In Part 2, we showed you how to use Istio’s built-in features and integrations with third-party tools to visualize your service mesh, including the metrics that we introduced in Part 1. While Istio’s containerized architecture makes it straightforward to plug in different kinds of visualization software like Kiali and Grafana, you can get deeper visibility into your service mesh and reduce the time you spend troubleshooting by monitoring Istio with a single platform.

Reinventing Hybrid Monitoring with AI and Automation

Adoption of hybrid cloud-public cloud services with on-premises resources, is gaining prominence among SMBs and large enterprises alike. This is principally because organizations can still maintain some elements of their enterprise on-premises while running other applications, like the e-commerce front-end in the cloud.

Lock-free Observations for Prometheus Histograms

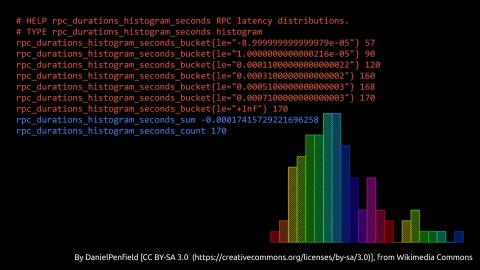
There’s a famous Go proverb that states: Don’t communicate by sharing memory; share memory by communicating. At GopherCon UK 2019, Björn Rabenstein, an engineer at Grafana and a Prometheus developer, told the audience that when it comes to observations for Prometheus histograms, that saying doesn’t hold true.

Quicker Azure Monitoring, Linux Change Detection, New API Poller - SolarWinds Lab #82 (Part 2)

The first step in improving system monitoring and visibility is getting data flowing sooner rather than later. For systems engineers managing diverse resources, it can be easier said than done. In this applications- and systems-focused conclusion of our year-end performance series, Server & Application Monitor (SAM) Senior Product Manager Serena Chou joins Head Geeks Patrick Hubbard and Sascha Giese to share shortcuts to streamline Azure monitoring configuration and get the cloud performance data you need, now.

The 6 best tech jobs of the future

You may already know it if you follow us on a regular basis: in Pandora FMS blog we love to look ahead to the future. And we have to tell you a secret: next to our coat rack, locked up in a dresser, we have a gleaming crystal ball that we check from time to time. To activate it, you just have to pronounce the word “monitoring” in a secret language that I will not reveal here, and that is when it lights up and shows us its knowledge.

How KeyBank used the Elastic Stack to build an enterprise monitoring solution

KeyBank is one of the largest banks in the United States. And as the bank has grown, so has their end-to-end monitoring system. With more than 1,100 branches and 1,400 ATMs stretching across 15 states, KeyBank’s infrastructure had evolved into a “Noah’s Ark of design,” says Mick Miller, Senior Product Manager, Cloud Native at KeyBank. In other words, they had two of everything, resulting in 21 different data islands.

InfluxDB 2.0 Open Source Beta Released

Today we announce InfluxDB 2.0 Open Source’s official move to Beta. This represents a huge step forward from where we started out nearly a year ago and is one step closer to general availability. You can download the latest version on our downloads page. Since we announced the first Alpha for InfluxDB 2.0 back in January ‘19, we have been working hard to build out and harden InfluxDB 2.0’s capabilities.