Operations | Monitoring | ITSM | DevOps | Cloud

Monitoring

The latest News and Information on Monitoring for Websites, Applications, APIs, Infrastructure, and other technologies.

Oracle Internet Directory Component Monitoring

Recently we have published an article about “New Release WLSDM 3.7.1 and WL-OPC 1.2.0 is common available!”. In this blog, we will examine the changes in OID 11g and 12c and how to track the component’s health through WLST and WLSDM. Please read complete blog post about the structure of Oracle Internet Directory and related OID component monitoring in WLSDM.

Key Features to Consider When Evaluating an Enterprise Kubernetes Solution

Digital transformation across industries is driving the need for IT to enable cloud-native applications. This has led enterprises to adopt Kubernetes as the most effective way to support cloud-native, container-based architectures, and to modernize their applications and IT infrastructure. Organizations of all sizes are looking to take advantage of Kubernetes – for both greenfield applications and for re-architecting and modernizing legacy applications.

Rack Mini Profiler: A Complete Guide on Rails Performance

Ruby on Rails makes writing web applications a pleasure. It’s a powerful and intuitive platform, built on an equally powerful and intuitive language. But that doesn’t mean it’s not worth taking the time to check your code for bottlenecks and performance problems before you ship. In this post, I’ll cover how to use Rack Mini Profiler to profile your Rails application.

11 amazing prototyping tools in 2019: choose the one for your needs

The first impression means a lot. The way how users perceive software has a direct impact on whether they will use this software or not. Therefore, the building of prototypes is very important for UI/UX design. Well, today, designers have many useful tools they can apply successfully to turn mockups into prototypes that may show the real value of web or mobile app. In this article, we will list the most popular prototyping in 2019, and we will divide them into free and paid ones. Let’s go!

Grafana Labs at KubeCon: Loki's March Toward GA

At KubeCon + CloudNativeCon EU this week, Grafana Labs VP Product Tom Wilkie gave a talk about Loki, the Prometheus-inspired service that optimizes search, aggregation, and exploration of logs natively in Grafana. In case you missed it, here’s a recap. Wilkie’s talk is an overview of how and why Grafana Labs built Loki and the features and architecture the team built in. Our policy is to develop projects in the open, so the design doc has been publicly accessible since development started.

Ensure Customer Happiness with these 5 Powerful Test Actions

Our fully managed Selenium testing platform allows you to continuously check your website to ensure it’s working as expected. Not just the fact that it’s online, but that your customers can perform tasks such as registering or adding products to the basket. We use real browsers, such as the latest versions of Chrome and Firefox and test from 18 global testing locations.

Native Crash Reporting: Symbol Servers, PDBs, and SDK for C and C++

Over a year ago, we first announced support for Minidumps in Sentry, which allows you to debug crashes from applications written in languages like C, C++, Objective-C and more — regardless of whether you’re targeting Windows, macOS, Linux, iOS, or Android.

Reset Dependency Monitors

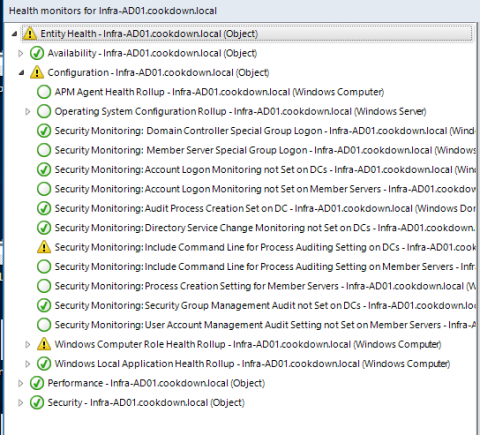
Resetting the monitor that triggered an alert is the best option in SCOM as it will allow the monitor to alert again, if needed. Working programmatically this is easy for alerts that are generated from a Unit Monitor. A Dependency Monitor can be more challenging, which is what we’ll address here. To properly reset your Dependency Monitor you will need to find the underlying Unit Monitor(s) and reset them.