Operations | Monitoring | ITSM | DevOps | Cloud

The latest News and Information on Monitoring for Websites, Applications, APIs, Infrastructure, and other technologies.

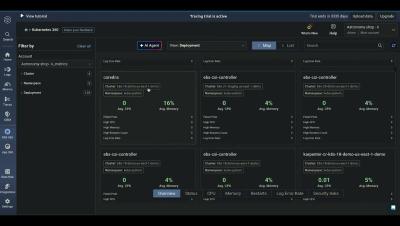
Logz.io Open 360 Platform Overview

Welcome to Logz.io, where we make monitoring, troubleshooting, and optimizing your systems easier than ever. Our AI-driven observability platform helps you: Ingest and manage your logs effortlessly Analyze and visualize data with powerful filtering & alerting Pinpoint root causes instantly with AI-powered RCA Optimize observability costs with DataHub Ensure peak system performance with Kubernetes 360 & App 360.

Think proactive monitoring for Teams Phone is too good to be true? Think again.

Collaboration platforms like Microsoft Teams are absolutely central to how enterprises get business done these days. But sometimes the fastest, most direct way to answer a question, solve a problem or make a connection is still to pick up the phone and call. The value of solutions like Microsoft Teams Phone is that they offer the best of both worlds: the simplicity and efficiency of voice communication integrated with digital collaboration tools and capabilities.

Resolving Redis connection issues with comprehensive log review

Redis is a highly efficient, versatile in-memory data store that is commonly utilized in modern applications. However, like any technology, it is not without its challenges, particularly when it comes to managing connections. By systematically reviewing Redis logs, you can diagnose and resolve these problems effectively. This blog provides an overview of Redis logs, explores their importance, and highlights how log management tools can simplify troubleshooting.

Resolving Kafka consumer lag with detailed consumer logs for faster processing

Apache Kafka is a distributed event streaming platform designed to handle large volumes of real-time data. It is widely used for messaging, logging, event processing, and real-time analytics. Kafka is known for its ability to handle high throughput, fault tolerance, and scalability, making it an essential tool for modern data-driven applications. Kafka operates with three main components: Latency refers to the time delay between when a message is produced and when it is consumed.

Right Data, Right Now: Why Timely, Actionable Network Observability is Essential

For teams in many organizations, the work of IT and network management keeps getting more difficult. A recent EMA survey offers some findings that clearly illustrate this point. When respondents were asked which networking skills are the most difficult to find, several roles received a response of 30% or more, including network security, network monitoring and troubleshooting, and data center networking.

Monitor Google Cloud: simplify and centralize your cloud provider observability with Grafana Cloud

Organizations increasingly rely on Google Cloud to power critical parts of their businesses, but managing those environments often involves navigating a labyrinth of disparate data, tools, and processes. We built Google Cloud Observability in Grafana Cloud to reduce the complexity and confusion by providing a unified, scalable solution designed to simplify monitoring, enhance visibility, and optimize costs.

Understanding the Observability Data Lifecycle: From Data Ingestion to Automated Actions

Modern IT estates are increasingly complex, generating vast amounts of data – some critical and actionable, but much of it mere noise. Extracting meaningful insights to ensure optimal system health and IT performance is beyond the scope of humans. This is where observability, enhanced by AI and automation, becomes essential.

Your App Might Be Down; Let's Fix It - Introducing Sentry Uptime Monitoring

Even at Sentry, we're not immune to downtime. In a moment of "oh-the-irony," we once took down our own application with a bad migration. We were adding a field to a critical database table, and the migration locked it completely. Since this table was essential to Sentry’s operation, the entire app went down. The website wouldn’t load, ingestion paused—everything ground to a halt.

Monitoring Kubernetes Resource Usage with kubectl top

Efficient resource utilization is key to running Kubernetes workloads smoothly. Whether you're troubleshooting performance issues, optimizing resource requests and limits, or keeping an eye on cluster health, the kubectl top command is an essential tool. It provides real-time CPU and memory usage metrics for nodes and pods, helping you make informed decisions about scaling and resource allocation.

AWS CSPM Explained: How to Secure Your Cloud the Right Way

As organizations expand their AWS footprint, maintaining visibility and control over configurations can be challenging. Misconfigurations, unnoticed vulnerabilities, and compliance gaps can create serious security risks. AWS Cloud Security Posture Management (CSPM) helps teams navigate these challenges by automating security checks, ensuring compliance, and providing continuous monitoring. Here’s what you need to know about AWS CSPM and why it’s essential for securing your cloud environment.