Operations | Monitoring | ITSM | DevOps | Cloud
The latest News and Information on Observabilty for complex systems and related technologies.
OpenTelemetry 101: A Non-Technical Guide to Starting Your Open Observability Journey
Gain agility through observability
As companies navigate geopolitical challenges, macroeconomic headwinds, and the post-pandemic comedown, business leaders face intense pressure to drive software transformation, reduce costs, and compete faster in the cloud-transition era of “lift and shift.” Amid layoffs and a slowed pace of hiring, the demand for better tools, real-time insights, seamless experiences, and contextual analysis has skyrocketed.
Troubleshoot faster and modernize your apps with AWS Monitoring and Observability
The Future of Observability is Bright as Honeycomb Announces $50M in Series D Funding
TL;DR—This is a fundraising post! Yes, even in this economy. Here at Honeycomb, we've always focused more on the problems we help our customers solve rather than playing the meta game of posturing in startup-land—so these fundraising blog posts are usually the least fun to write (and read, probably). But this one is a little different.
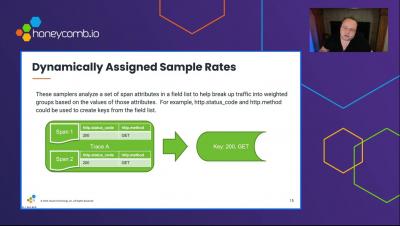
Successful Sampling With Refinery
Revolutionize Your Observability Data with Cribl.Cloud - Streamline Your Infrastructure Hassle-Free!
Airlines aiming to transform need modern Observability
The last decade has been nothing but a roller coaster ride for the airline industry. The pandemic has transformed it forever and now it needs to reevaluate its digital transformation priorities on how to manage traveler expectations. Taking it a step further, travelers buying behavior is changing farther as now they will want to book tickets while chatting with an AI interface. The transformation was already underway. In 2020, Google Cloud and Sabre announced a partnership to modernize Sabre. Recently, American Airlines announced their modern rebooking app launched in partnership with IBM. Lufthansa announced industry's first continuous pricing tailored to suit individual customer attributes.
eBPF Explained: Why it's Important for Observability
eBPF is a powerful technical framework to see every interaction between an application and the Linux kernel it relies on. eBPF allows us to get granular visibility into network activity, resource utilization, file access, and much more. It has become a primary method for observability of our applications on premises and in the cloud. In this post, we’ll explore in-depth how eBPF works, its use cases, and how we can use it today specifically for container monitoring.


