Setting Up a Data Loop using Cribl Search and Stream Part 4: Putting it All Together
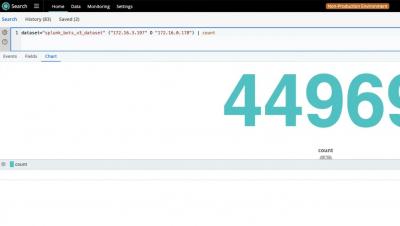
The final section of our video series showcases how to put the data loop to use with a real-world dataset. We utilize the public domain “Boss of the SOC v3” dataset, which is readily available on GitHub. First, we employ Cribl Search to sift through and explore the BOTSv3 data that is stored in an S3 bucket to locate some specific data.